Quantcast
Channel: Winners’ Interviews – No Free Hunch
Viewing all 62 articles
Browse latest View live

March Machine Learning Mania, 5th Place Winner's Interview: David Scott

$
0
0

Kaggle's annual March Machine Learning Mania competition  drew 442 teams to predict the outcomes of the 2017 NCAA Men's Basketball tournament.  In this winner's interview, Kaggler David Scott describes how he came in 5th place by stepping back from solution mode and taking the time to plan out his approach to the the project methodically.

The basics:

What was your background prior to entering this challenge?

 I have been working in credit risk model development in the banking industry for approximately 10 years. It isn’t a massive stretch from my original degree in Actuarial Mathematics and Statistics.     

I have been lucky to receive exposure to big data and data science through previous roles but decided I wanted to teach myself R and to improve my machine learning knowledge. The best opportunity seemed to be to utilise Kaggle datasets where I could to help with this.

What made you decide to enter this competition?

I had started using some of the titanic data to learn some R but I am a massive sports nut. So when the opportunity came up to get data to predict March Madness I couldn’t resist. This was my first entry in a Kaggle competition outside of the training exercises.

Let's get technical:

How did you approach the problem?

At first I dived into the data. As I played and wasn’t achieving the success I was hoping for, I had a realisation. How would I approach this problem at work? I had rushed into solution mode without planning out the project and hadn’t considered what I had expected to see. At that point I realised I had to consider 3 important things.

  1. Finding out what the experts reviewed to predict March Madness (Experts).
  2. Be careful structuring my data to make sure I didn’t over fit (Data Construct).
  3. Figure out what model development technique I would use for my final model (Model Development).

Experts - Did any past research or previous competitions inform your approach?

No. It would have been a good idea but instead I started listing to podcasts on college basketball. This gave me an understanding of what the commentators use when they are evaluating a good team and looked to make sure this information was included in my final model.

Data Construct - What pre-processing and feature engineering did you do?

I spent most of my time creating a linear model predicting the best teams based on their regular season results using the points’ difference as the target variable. This gave me a rank order of teams that was my main predictor in my model. Outside of that my time was spent matching data from other sites to get things like Strength Of Schedule, etc.

I also made sure to split the data into enough segments that the model would not overfit. This included splitting the development data into a build and validation sample and leaving the test data provided for the last 4 years. Each change in the development was evaluated for consistency with the others.

What supervised learning methods did you use?

I kept it simple with a logistic regression. This is something I am very familiar with and something I thought it would work well for this problem.

Words of wisdom:

What have you taken away from this competition?

The main take away from this competition was that data and how you use it was more important than the modelling technique. I stuck with a basic logistic regression technique for the model development and it appeared to work well.

Looking back, what would you do differently now?

I would have factored in that games at the later stages of the tournament would be close. I ran out of time to consider that if teams met in the final 4 regardless of their rating before the tournament it is likely to be close. This meant that 1 upset towards the end of the tournament could have derailed my finishing position.

Do you have any advice for those just getting started in data science?

I don’t really have advice for getting started in data science but I would suggest having a go at the problem datasets in Kaggle. In the competitions I would suggest taking time to think about the problem and plan in advance before diving in. If you find out what the experts consider to be useful, chances are you won’t be far off.

Just for fun:

If you could run a Kaggle competition, what problem would you want to pose to other Kagglers?

I have more of a problem I would like to pose to other Kagglers. I am a massive F1 fan and I have always been interested in understanding what the car contributes and what the driver contributes. This way I could figure out the best driver of all time. I have a source of data that I would be happy post on Kaggle for some assistance if people are interested.

What is your dream job?

I am very fortunate that I really enjoy understanding what can be used to predict different events and learning new techniques as I go. My career to date has allowed me lots of opportunities to do this.


2017 Data Science Bowl, Predicting Lung Cancer: 2nd Place Solution Write-up, Daniel Hammack and Julian de Wit

$
0
0

This team's solution write-up was originally published here by Daniel Hammack and cross-posted on No Free Hunch with their permission.

Foreward

Julian and I independently wrote summaries of our solution to the 2017 Data Science Bowl. What is below is my (Daniel’s) summary. For the other half of the story, see Julian’s post here. Julian is a freelance software/machine learning engineer so check out his site and work if you are looking to apply machine intelligence to your work. He won 3rd in last year’s Data Science Bowl too!

This blog post describes the story behind my contribution to the 2nd place solution to the 2017 Data Science Bowl. I will try to describe here why and when I did certain things but avoid the deep details on exactly how everything works. For those details see my technical report which has more of an academic flavor. I’ll try to go roughly in chronological order here.

The Results

I hate it when the final result is used to maintain suspense throughout an article. So here are the results up front:

2nd place finish in the largest Kaggle competition to date (in terms of total prize pool = $1 million).

And here’s two cool .gifs showing one of my models at work (red = cancer):

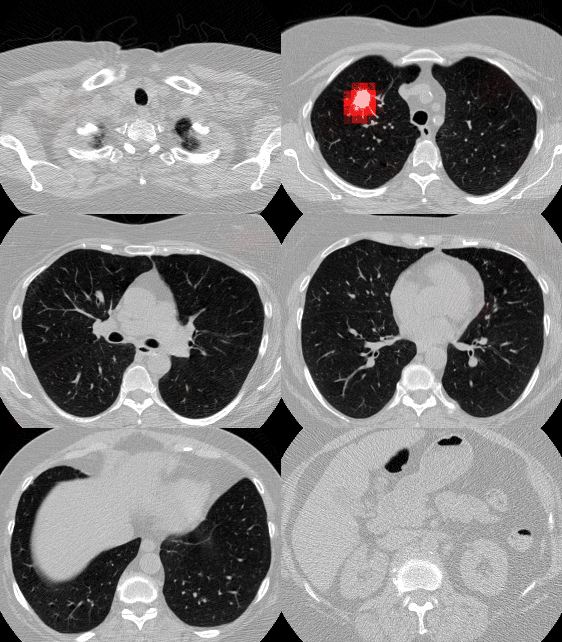
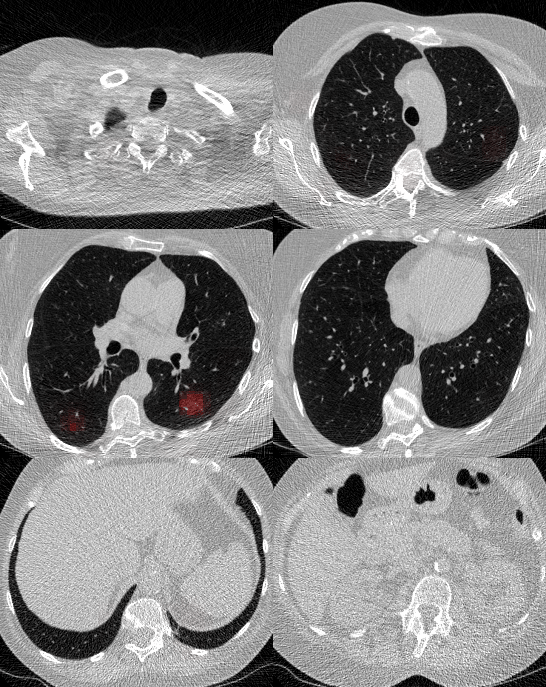
most important parts of the scan most important parts of another scan
 

The Beginning

I got an email when the 2017 DSB launched. It said something along the lines of “3D images and a million bucks” and I was sold. I haven’t worked on 3D images before this so I thought it would be a good learning experience. The fact that there were payouts for the top 10 finishers, and the competition was for a good cause (beating lung cancer) were also quite motivating.

Preprocessing

The beginning of the competition was focused on data prep. CT scans are provided in a medical imaging format called “DICOM”. As I had no prior background with DICOM files, I had to figure out how to get the data into a format that I was familiar with - numpy arrays.

This turned out to be fairly straightforward, and the preprocessing code that I wrote on the second day of the competition I continued using until the very end. After browsing the forum, reading about CT scans, and reading some of the reports from the LUNA16 challenge I was good to go.

Basically CT scans are a collection of 2D greyscale slices (regular images). So you just need to concatenate them all in the right order (and scale them using the specified slope + intercept) and you’re set. A tricky detail that I found reading the LUNA competition is that different CT machines will produce scans with different sampling rates in the 3rd dimension. The distance between the consecutive images is called the ‘slice thickness’ and can vary up to 4x between scans. So in order to apply the same model to scans of different thickness (and to make a model generalize to new scans) you need to resize the images so that they have the same resolution. My solution, Julian’s solution and all the others I’ve seen sampled the scans to a resolution of 1 mm^3 per voxel (volumetric pixel).

So the first thing I did was convert all the DICOM data into normalized 3D numpy arrays.

External Data

Keeping an eye on the external data thread post on the Kaggle forum, I noticed that the LUNA dataset looked very promising and downloaded it at the beginning of the competition.

The LUNA16 challenge is a computer vision challenge essentially with the goal of finding ‘nodules’ in CT scans. It contains about 900 additional CT scans. In case you are not familiar, a ‘nodule’ is another word for a tumor. Here’s an example of a malignant nodule (highlighted in blue):

malignant nodule
This is from a small 3D chunk of a full scan. To put this nodule in context, look at the first big .gif in this post.

Anyway, the LUNA16 dataset had some very crucial information - the locations in the LUNA CT scans of 1200 nodules. See, finding nodules in a CT scan is hard (for a computer). Very hard. An average CT scan is 30 x 30 x 40 centimeters cubed while an average nodule is 1cm cubed. This means that the average scan is 36,000 times larger in volume than the cancer we’re looking for. For an automated system with zero knowledge of human anatomy (and actually zero prior knowledge at all), figuring out which one or two areas in a scan really matter is a very hard task. It’s like showing someone a 150 page report (single-spaced) and telling them that there is one word misspelled that they need to find.

So this LUNA data was very important. To sweeten the deal, the LUNA dataset turns out to be a curated subset of a larger dataset called the LIDC-IDRI data. Now most of the information in these two datasets is the same, but the LIDC dataset has one thing that LUNA didn’t - radiologist descriptions of each nodule they found. The creators of the LUNA dataset threw out this data when they created their dataset (because it wasn’t relevant to them). However it is extremely relevant to the task of predicting cancer diagnosis.

So I downloaded the LIDC annotations and joined them onto the LUNA dataset. Ultimately this means that I had 1200 nodules and radiologist estimations of their properties. The properties that I chose to use were:

  • nodule malignancy (obviously!)
  • nodule diameter (size in mm, bigger is usually more cancerous)
  • nodule spiculation (how ‘stringy’ a nodule is - more is worse)
  • nodule lobulation (how ‘bubbly’ a nodule is - more is worse)

There is a report posted on the forums that describes some of the relationships between nodule attributes and malignancy.

Figuring out that the LIDC dataset had malignancy labels turned out to be one of the biggest separators between teams in the top 5 and the top 15. The 7th place team, for example, probably would have placed top 5 if they had seen that LIDC had malignancy.

The way I found the LIDC malignancy information is actually a funny story. A month into the competition, someone made a submission to the stage 1 leaderboard that was insanely good. In hindsight they were overfitting, but at the time I didn’t know this. I assumed they had discovered some great additional source of data so I dug around more and found the LIDC malignancy labels!

Julian proceeded in much the same way, and independently discovered and used the LUNA and malignancy annotations.

First Approaches

The beginning of a competition is the most interesting part, especially when there isn’t an obvious solution to the problem like this one. For at least a week I tried a few things without success, namely:

  • Downsampling all the data to 128 x 128 x 128 mm and building ‘global’ models (NOT using the LUNA data)
  • Breaking up the 1400 training scans into smaller chunks and trying to predict whether each chunk belonged to a cancer/noncancer scan

I think the third thing I tried was using the LUNA data. At first I built a model (using 64mm cube chunks) where the model was trained to predict the probability of a given chunk containing a nodule. Then to generate a prediction for a whole scan (remember 300 x 300 x 400 mm in size), I “rolled” my model over the whole scan to get a prediction at each location. To make sure not to miss any parts, the model needs to be scored a few hundred times.

Doing this gives you a 3D grid of ‘nodule probabilities’ (because the model predicts the probability of a nodule at each location). I then aggregated these with some simple stats like max, stdev, and the location of the max probability prediction.

With these simple stats, you can build a ‘regular’ model (Logistic Regression) to forecast the diagnosis. This model is trained and validated on the Kaggle DSB dataset.

After doing some initial tests on the training set (cross validation), I was expecting my leaderboard score to be around 0.482 (random guessing will get you 0.575). I did a submission and it scored 0.502 on the stage 1 leaderboard which was a little disappointing. However it was good enough to put me in the top 10 for a few days. And I finally found something that worked!

Pulling the Thread

Now that I had something that worked, I decided to see how far I could push it. There were a couple of no-brainer improvements that I made:

  • Instead of predicting probability of a nodule existing, predict the size of the nodule (nodule size is in the LUNA dataset).
  • Add data augmentation (described below)
  • Improved model architecture (mainly added more batch norm)
  • After discovering their existance, add LIDC features (malignancy especially)
  • Improved aggregation of chunk predictions
  • Improving final diagnosis model (Logistic Regression + Extra Trees)

Doing all this improved my cross-validation score (my estimated leaderboard score) to 0.433! So naturally I did a submission and it came out significantly worse at 0.460.

Data Augmentation

What if I told you you could have an infinite amount of data to build your models on? Well with Data Augmentation™ you can!

Data augmentation is a crucial but subtle part of my solution, and in general is one of the reasons that neural networks are so great for computer vision problems. It’s the reason that I am able to build models on only 1200 samples (nodules) and have them work very well (normal computer vision datasets have 10,000 - 10,000,000 images).

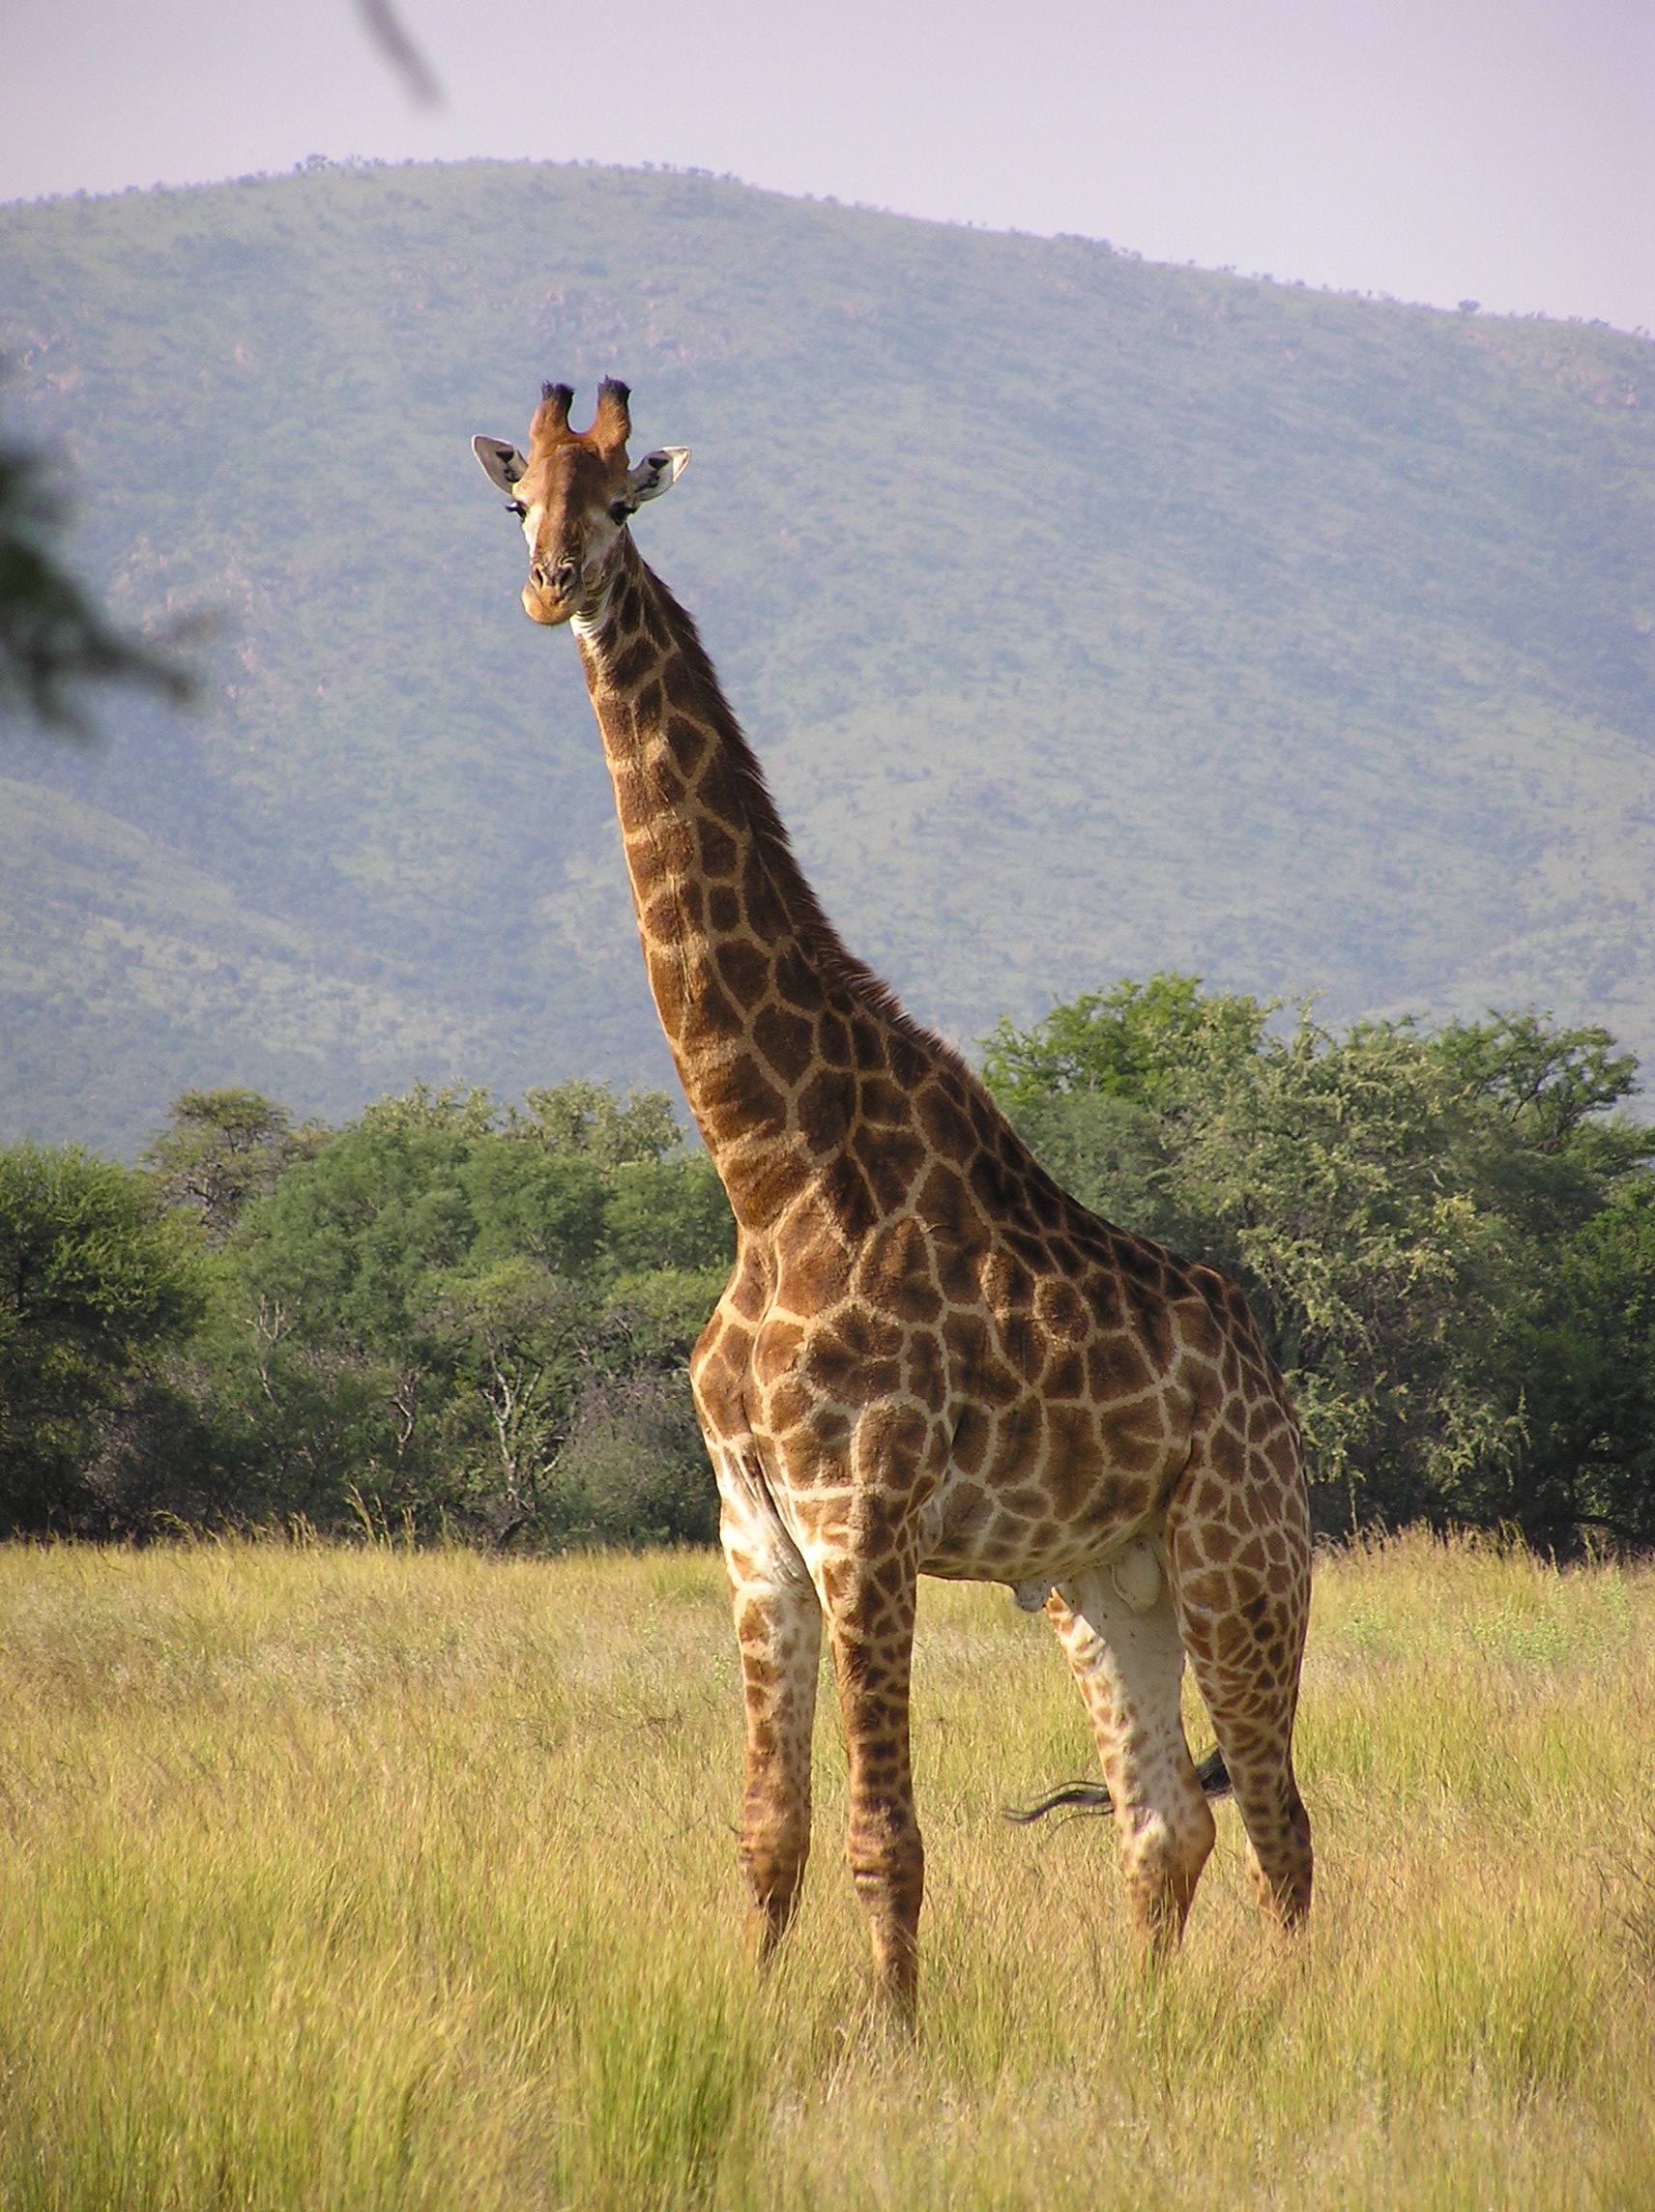
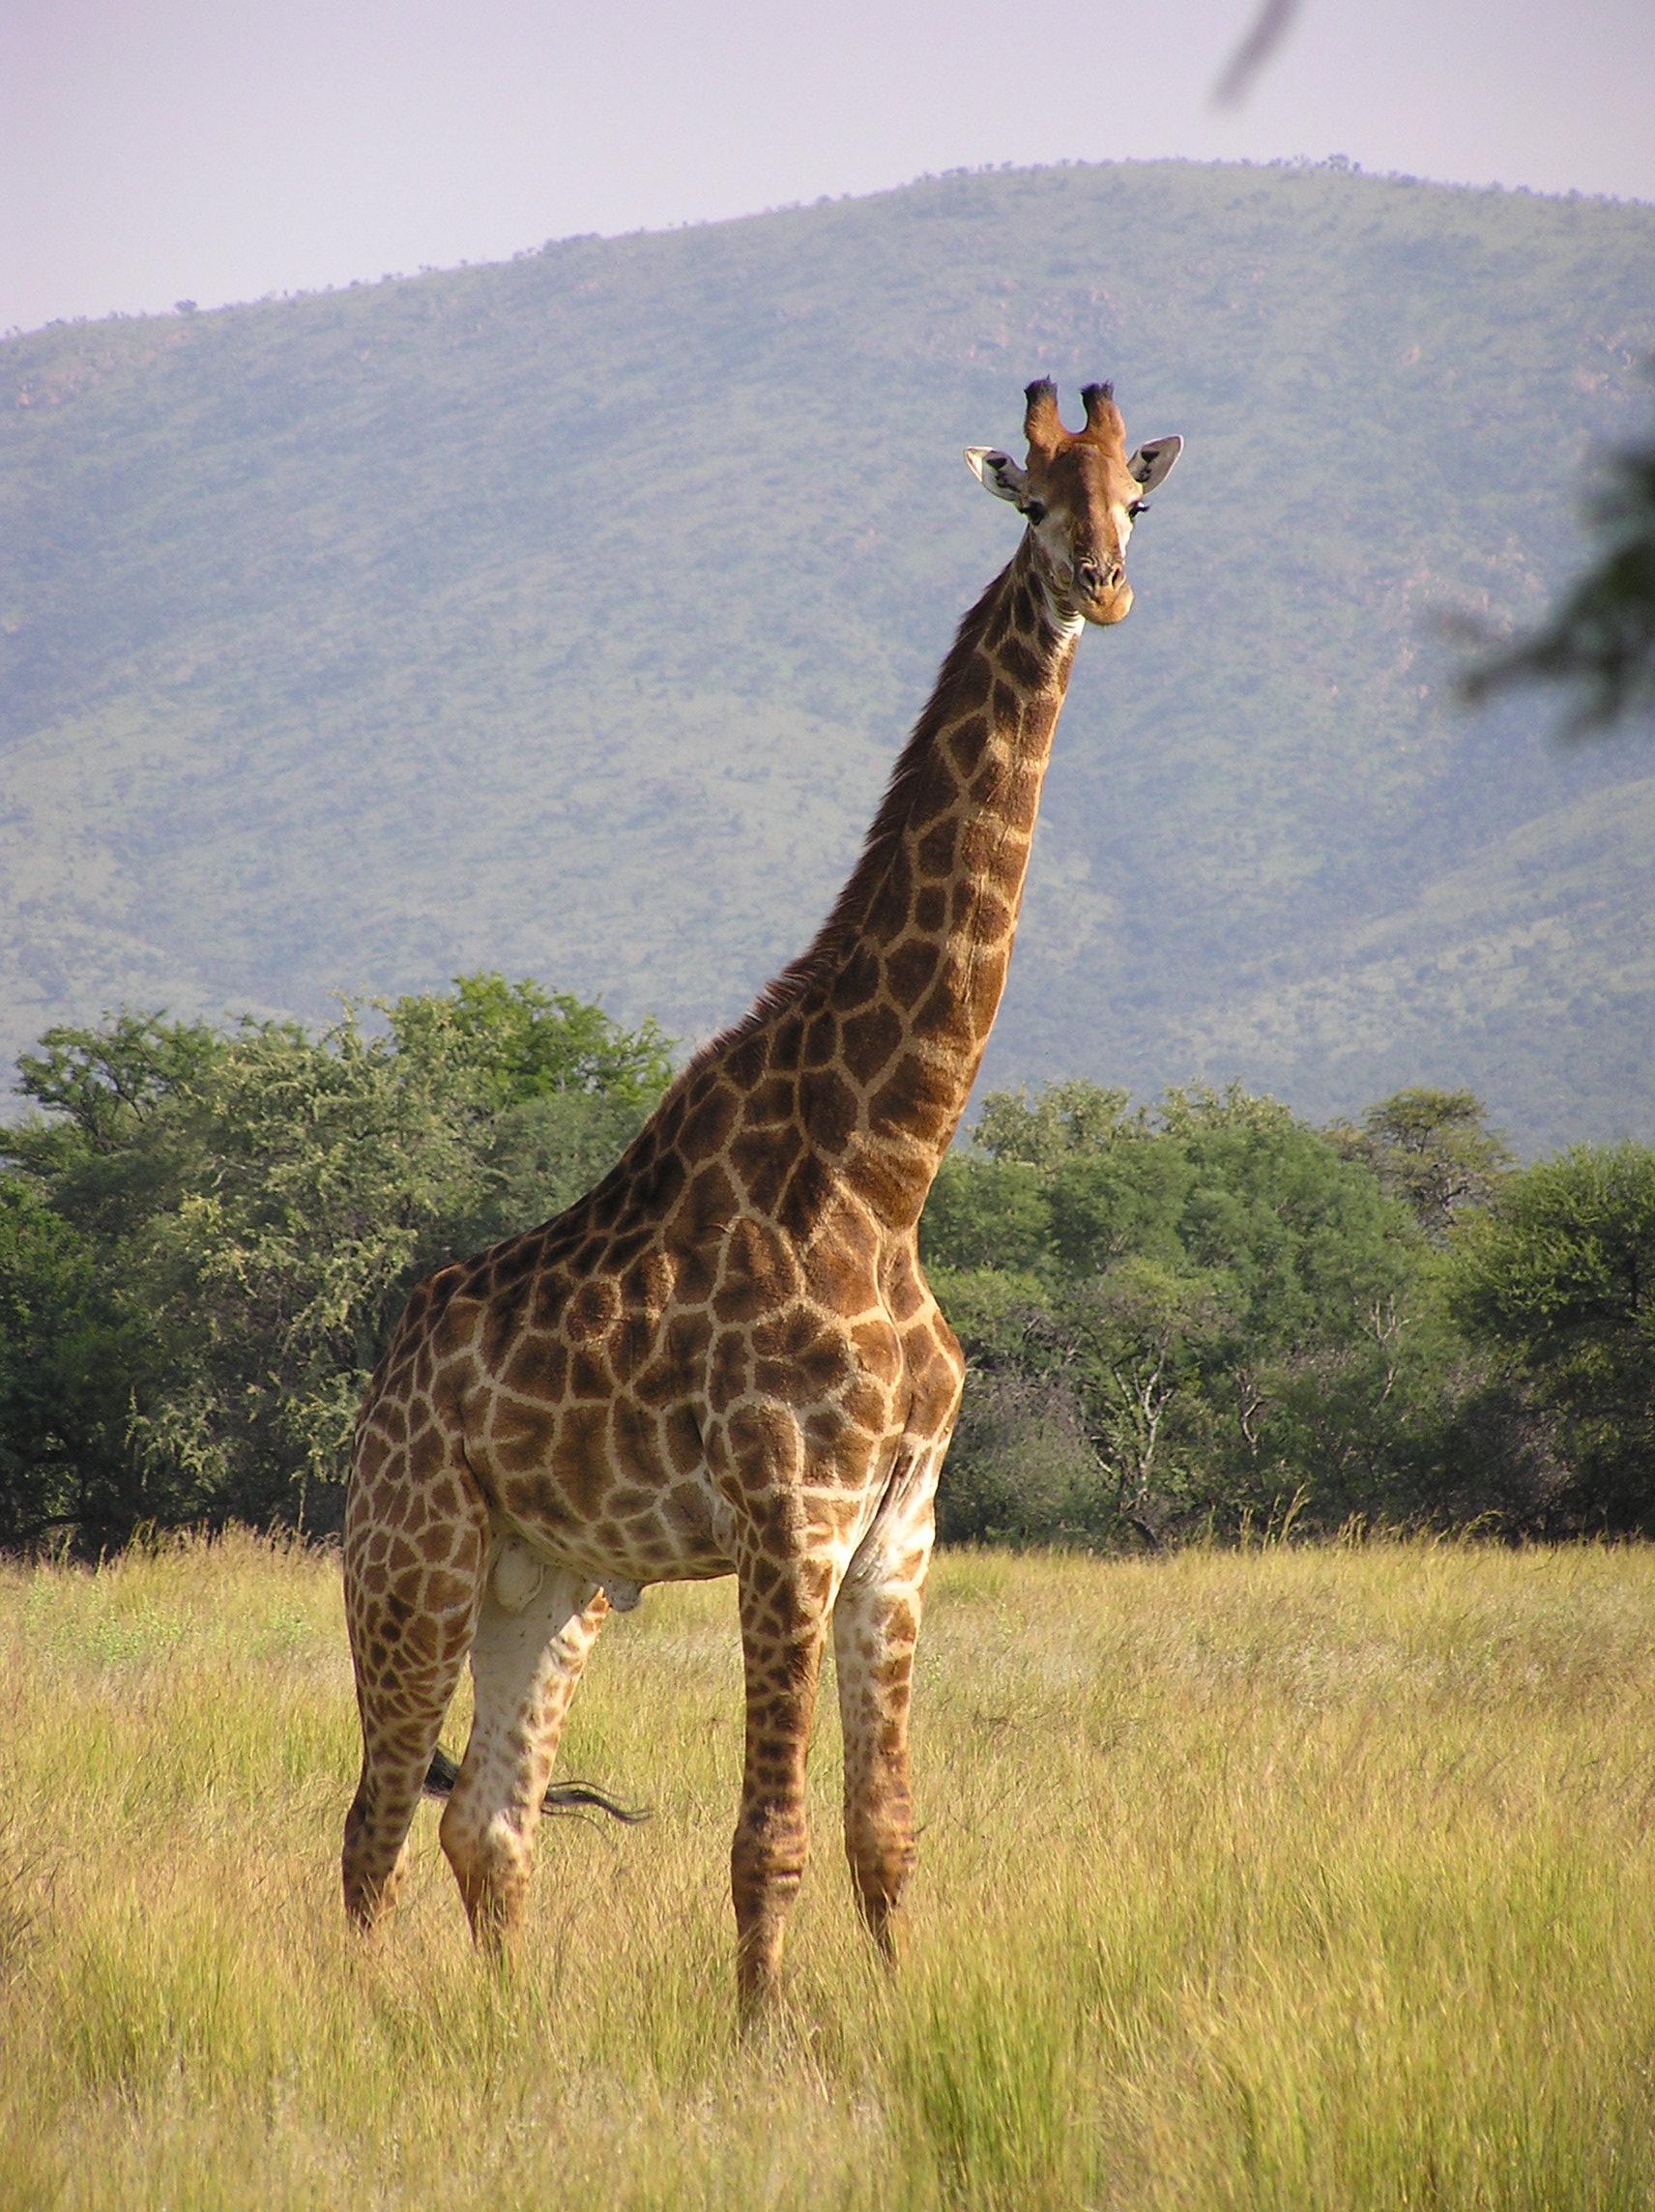
The idea is this - there are certain transformations that you can apply to your data which don’t really ‘change’ it, but they change the way it looks. Look at these two pictures:

giraffe effarig
They’re both giraffes! However to a neural network model these are totally different inputs. It might think one is a giraffe and another is a lion.

Mirroring is an example of a ‘lossless transformation’ of an image. Lossless here is in terms of information - you don’t lose any information when you mirror an image. This is opposed to ‘lossy transformations’ which do throw away some information. A rotation by 10 degrees is an example of a lossy transformation - some of the pixels will get a little messed up but the overall spirit of the image is the same.

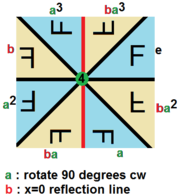
With 3D images, there are tons of transformations you can use, both lossy and lossless. This sort of thing is studied in a branch of mathematics called Group Theory, but just using some quick googling we can find out that there are 48 unique lossless permutations of 3D images as opposed to only 8 for 2D images! In both 2D and 3D there are an infinite number of lossy transformations as well.

Here’s a cool graphic of the lossless permutations of a 2D image:

there are 8 lossless permutations of a 2d image
So how does this help us? Well each time before showing a chunk from a CT scan to the model, the chunk can be transformed so that it’s ‘meaning’ remains the same but it looks different. This teaches our model to ignore the exact way an image is presented and instead focus on the unchanging information contained in the image. We say that the model becomes ‘invariant’ to the transformations we use which means that applying those transformations will no longer change it’s prediction.

However the model, like some people I know, isn’t perfect. Sometimes if you rotate an image in a certain way, the model will change its prediction of malignancy a little. To exploit this, you can show an image to the model a bunch of times with different random transformations and average the predictions it gives you. This is called “test time augmentation” and is another trick I used to improve performance.

All the top competitors including Julian and I used data augmentation heavily. Some teams only used 2d augmentation which I believe limited their performance.

Leaderboard Woes

One of the most difficult parts of this competition was the small number of CT scans available. The first stage leaderboard, for example, used only 200 scans. Furthermore, only 25% (50 of them) showed lung cancer. Because of this, the leaderboard feedback for the first 3 months of the competition was extremely noisy. You could obtain a very good score on the leaderboard by just making lots of submissions and keeping the best one. To counteract this, Kaggle made the competition have two stages. The first stage went on for 3 months and the second stage went on for a few days. The data for the second stage wasn’t released until the first stage ended, and you had to submit your finalized model to Kaggle before the second stage started. This means there was no way to manually label the second stage data to gain an advantage. The second stage also had more data (500 scans) so the final leaderboard was more reliable than the first stage. You can read more about the competition format here.

Because the competition was strucured this way, I really had no idea how good my solution was compared to everyone else until it was over. It was very tough to make small improvements while watching people leap way above me on the leaderboard. I think at the end of the first stage I was probably between 30th and 40th on the leaderboard.

One other implication of the leaderboard noise is that it is nearly impossible to team up with someone unless you have worked with them before. Julian and I were lucky to have both worked together before so we each knew that the other was unlikely to have just overfit the public leaderboard.

The Middle

I spent the remainder of the competition fine tuning this basic approach. A lot of experimentation was done with the objective function for the models, what fraction of nodules/non-nodules to use in training, and the best way to generate a global diagnosis from the nodule predictions.

I also came up with a neat trick for speeding up the training of my models during this phase. During experimentation, I found that if you build models on 32x32x32 mm crops of nodules they train much faster and achieve much better accuracy. However when you want to apply that model across a full scan, you have to evaluate it something crazy like 3000 times. Each time the model is evaluated at a location there is a chance of a false positive, so more evaluations is definitely not desirable. Building 64x64x64 models, on the other hand, takes longer and isn’t quite as good at describing nodules but ultimately works better. Comparing the two, the 64 sized model requires 8x fewer evaluations than the 32 sized model while only being slightly less accurate.

A reasonable question to ask at this point is - why not bigger than 64? Well I tried that. It turns out that 64 is a sort of ‘sweet spot’ in chunk size. Remember that our models rely heavily on exploiting the symmetries of 3D space. Well it turns out that the lungs in general aren’t that symmetric. So if you keep making your chunk size larger, data augmentation becomes less effective. I do believe that a chunk size of 128 could work, but I didn’t have the patience to train models of that size as it generally takes 8x longer than 64 sized models.

Anyway, one of the nice things about the architecture that I used was that the model can be trained on any sized input (of at least 32x32x32 in size). This is because the last pooling layer in my model is a global max pooling layer which returns a fixed length output no matter the input size. Because of this, I am able to use ‘curriculum learning’ to speed up model training.

Curriculum learning is a technique in machine learning where a model is first trained on simpler or easier samples before gradually progressing to harder samples (much like human learning). Since the 32x32x32 chunks are easier/faster to train on than 64x64x64, I train the models on size 32 chunks first and then 64 chunks after.

Julian, through some sort of sorcery or perhaps black magic, was able to make 32mm^3 models work. Actually his black magic is a multi-resolution approach which you can read about in his blog post.

Teamwork

With about 3 weeks left I the competition I decided to team up with Julian de Wit. I had worked with Julian on a competition before, and we were both worried that we didn’t stand a chance alone. Julian is an excellent data scientist and had a solution to this problem which was quite similar to mine. You can read about his solution here.

The method we used to combine our solutions ended up being quite simple - both of our systems made diagnoses for each patient and then we just averaged them. Our solutions were approximately equal in strength, and if I had to estimate we probably both would have ended up between 6th and 8th place if we competed individually. One second place solution for two 7th place solutions is a pretty good trade off!

I was fortunate that Julian entered the competition. Normally in a Kaggle competition, it is easy to see who has a good solution and who doesn’t - and obviously you can ask others with good solutions to team up. However in this competition, due to how unreliable the stage 1 leaderboard was (as mentioned above), there’s no way I could have teamed up with someone new. Because I had worked with Julian on a prior competition, I knew he was good so I could trust his results.

Ensembling

Ensembling is another common sense trick widely used in Kaggle competitions (and the real world). The idea is simple - if you want to get a better answer then you should ask several people and consider all their answers. And if you want to get better cancer predictions, you should build a bunch of different cancer models and average them!

ensembling averages out errors
This strategy works best when the answers (predictions) are both accurate and diverse. With knowledge of this phenomenon, I spent the last few weeks of the competition trying to build lots of models which were as accurate as my best but used different settings (to add diversity). For those with a background in training neural nets, the parameters that were tweaked to get diversity were:
  • the subset of data the model was trained on (random 75%)
  • activation function (relu/leakly relu mostly)
  • loss function and weights on loss objectives
  • training length/schedule
  • model layer sizes
  • model connection/branching structure

Ultimately I built two ‘ensembles’ of models. The first ensemble I built really in an ad-hoc manner - during the process of tuning my neural net structure I trained a bunch of models. Many of them turned out to have similar performance, so I threw them all into an ensemble. This ensemble had a CV score of 0.41 (remember the prior best was 0.433 - averaging helps!).

The second ensemble was more systematic (described below). Julian also built several models and ensembled them as part of his solution.

The Nuclear Option

Once I decided that I wasn’t going to make any more breakthroughs, I set my sights on building a second ensemble with as many good models as possible. To speed things up, I decided to experiment with an AWS GPU instance (p2.xlarge, comes with a NVIDIA K80 GPU). This turned out to be a great decision. It only took me a few hours to set up using the deep learning AMI they provide, and I found that suddenly my models trained 5x faster! (Nvidia and Amazon - I will accept a new 1080Ti GPU as payment for this product placement).

I still don’t know for sure why my models train so much faster on AWS compared to my PC at home (Titan X). The current leading theory is that I have PCI v2 in my motherboard which is limiting the GPU to CPU bandwidth. Anyway, I was suddenly able to train 5 models in the time that it had originally taken me to train one. So naturally I made each model bigger so that they no longer trained any faster 🙂

At this point in the competition I had a pretty good feel for what worked and what didn’t in terms of neural network models. I ended up building 6 new models. Each one had a CV score of around 0.4 to 0.41, and when all combined they scored 0.390 in local cross-validation!

Wrapping Up

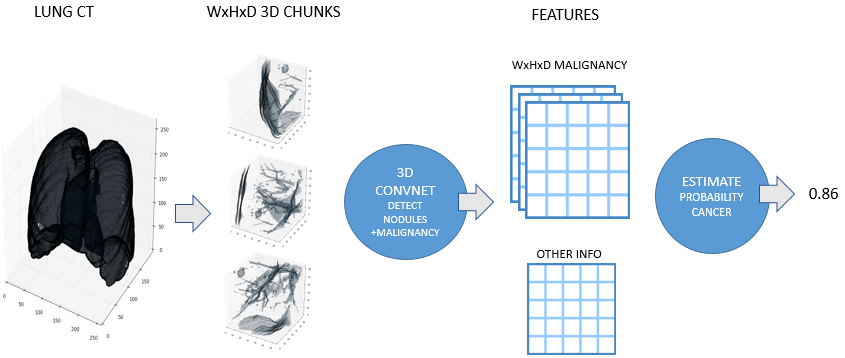
By the end of the competition, I had a pretty good pipeline set up for transforming a CT scan into a cancer diagnosis. The steps are:

  1. Normalize scan (see Preprocessing above)
  2. Discard regions which appear normal or are irrelevant
  3. Predict nodule attributes (e.g. size, malignancy) in abnormal regions using a big ensemble of models
  4. Combine nodule attribute predictions into a diagnosis (probability of cancer)

Julian developed a very similar approach independently for his solution. Here is a high level overview image from his blog post:

Solution Overview (by Julian de Wit)
Scan preprocessing didn’t change significantly throughout the competition. However one of the later additions was an ‘abnormality’ detector.

Detecting Abnormalities in CT Scans

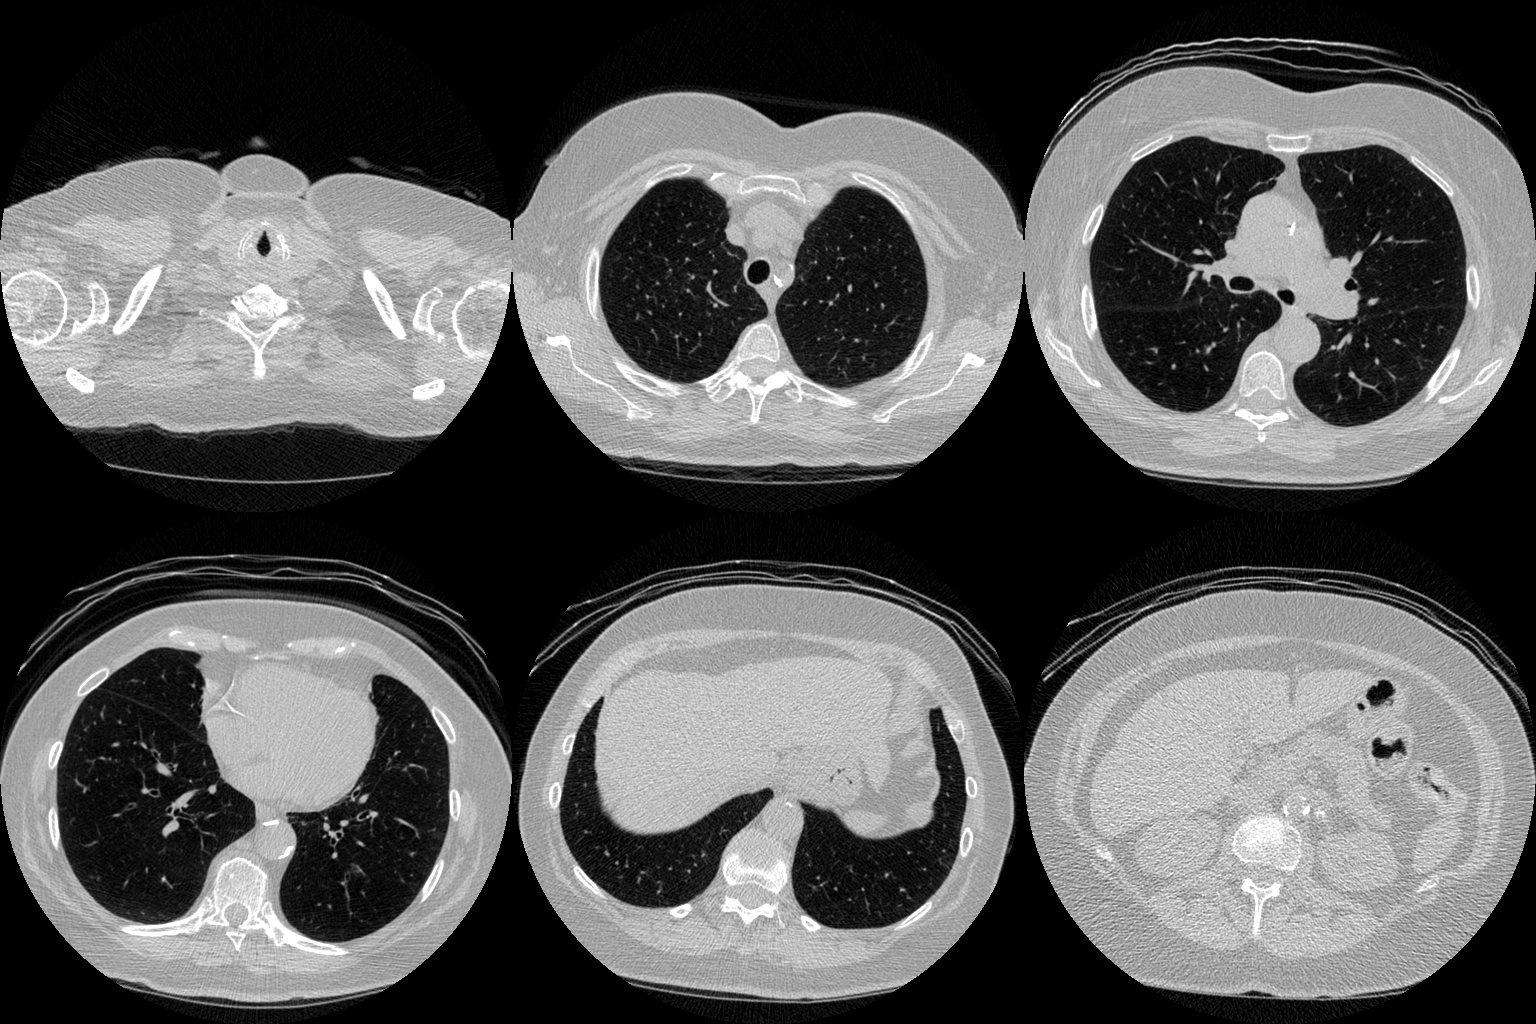
The vast majority of every CT scan is not useful in diagnosing lung cancer. There are several reasons for this, but most obvious is that much of the CT scan data is covering locations outside the lungs! The below .gif shows a typical CT scan before being cropped. The lungs are the big black spaces - note how a large portion of the scan doesn’t overlap with the lung interior at all.

Much of a CT scan is exterior to the lung
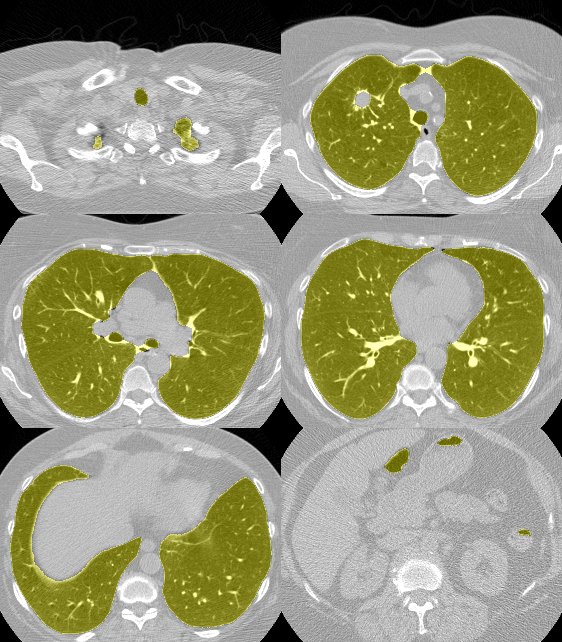
I found some code for doing ‘lung segmentation’ on the Kaggle forum. The idea behind lung segmentation is simple - identify the regions in the scan which are inside the lung. Here’s what a scan looks like after finding the interior (in yellow) and cropping out the parts of the scan which don’t overlap with the interior:

yellow = interior
So far, so easy. Now it gets trickier. Next I broke up the CT scan into small overlapping blocks. I then fed each block (of size 64 mm cubed) into a small version of my nodule attribute model (a neural network). This model is specifically designed not to be super accurate at describing nodules, but to be good at not missing any nodules. In technical terms, it has high sensitivity. This means that it likely returns lots of ‘false positives’, or regions which don’t actually contain nodules. On the other hand, it shouldn’t miss any true nodules.

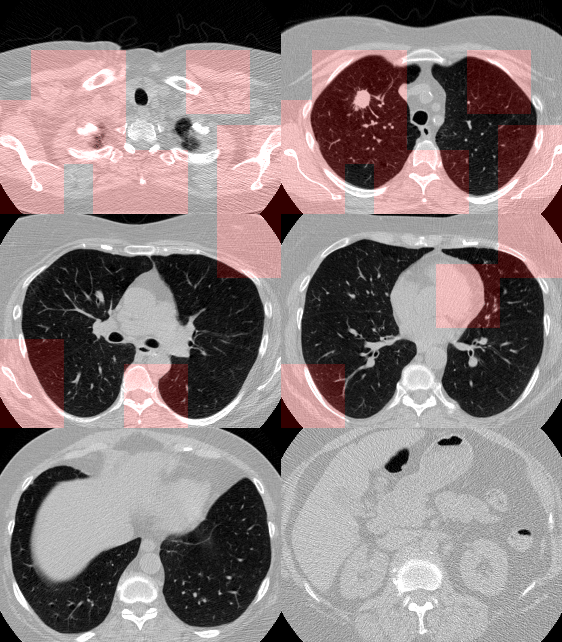
Here’s a CT scan with the ‘abnormal’ blocks highlighted in red.

red means look more closely
This process ultimately reduces the volume that we need to search by 8x. Skipping this step is possible but it would increase the time it takes to process each scan significnatly. This step is extra impactful because I use large ensembles next.

Predicting Nodule Attributes

After discarding the majority of the CT scan, it’s time to use the big ensembles of neural networks on what’s left. For each block idenfitied as ‘abnormal’ by the prior step, I run it through all of the nodule models. Because each model was trained with different settings, parameters, data, and objectives, each model gives a slightly different prediction. Also each model is shown each block several times with random transformations applied (as dicussed in the data augmentation section above). Predictions are averaged across random transformations but not across models (yet).

Here are some examples of ‘suspicious blocks’ which turned out to have malignant nodules. These are colored based on how important each part of the block is to the malignancy prediction for the entire block.

malignant nodule malignant nodule
The output of this stage is one prediction per model per suspicious region in the image. These become the inputs to the next part of the pipeline which produces the actual diagnosis.

Diagnosis

Forming a diagnosis from the CNN model outputs turned out to be quite easy. Remember at this point we have model predictions of several attributes (nodule malignancy, size, spiculation) at many different places in each scan. To combine all these into a single diagnosis, I created some simple aggregates:

  • max malignancy/spiculation/lobulation/diameter
  • stdev malignancy/spiculation/lobulation/diameter
  • location in scan of most malignant nodule
  • some other clustering features that didn’t prove useful

These features are fed into a linear model for classification. Below is a feature importance plot, with the Y-axis showing the increase in log-loss when the specified feature was randomly scrambled:

feature importance
I have added some purely random features into this analysis to provide an idea of significance. It’s fairly clear from this that the max malignancy prediction is the most important feature. Another very important feature is the location of the most malignant nodule in the Z dimension (i.e. closer to head or closer to feet). This is also a finding that I saw in the medical literature so it’s pretty neat to independently confirm their research.

Very late in the competition, my teammate Julian came up with a new feature to add to the diagnosis model - the amount of ‘abnormal mass’ in each scan. I added this to my set of features but neither of us really had enough time to really vet it - we both think it helped slightly. If you are interested in reading more about Julian’s approach, check out his blog post here.

The End

That’s it! The code for my solution is on my GitHub page, Julians part is on his Github, and my technical writeup is here. Feel free to reach out if you have any questions. If you got this far then you’ll probably also enjoy reading Julian’s solution here.

Thanks

Kaggle & Booz Allen Hamilton - it was a very interesting competition. We were also encouraged by the hope that our solution to this problem will be more widely useful than just winning some money in a competition - hopefully it can be used to help people!

Julian - Julian was a great teammate and is an excellent machine-learning engineer. He does consulting work so definitely keep him in mind if you have a project that requires some machine intelligence.

Open source contributors to Python libraries - there’s no way we could have achieved this in such a short time without all the well-written open-source libraries available to us.

My girlfriend - thanks for being understanding while I spent nearly every minute of my free time on this project.

Bios

Julian De Wit is a freelance software/machine learning engineer from the Netherlands.

Daniel Hammack is a machine learning researcher from the USA working in quantitative finance.

The Nature Conservancy Fisheries Monitoring Competition, 1st Place Winner's Interview: Team 'Towards Robust-Optimal Learning of Learning'

$
0
0

This year, The Nature Conservancy Fisheries Monitoring competition challenged the Kaggle community to develop algorithms that automatically detects and classifies species of sea life that fishing boats catch.

Illegal and unreported fishing practices threaten marine ecosystems. These algorithms would help increase The Nature Conservancy’s capacity to analyze data from camera-based monitoring systems. In this winners' interview, first place team, ‘Towards Robust-Optimal Learning of Learning’ (Gediminas Pekšys, Ignas Namajūnas, Jonas Bialopetravičius), shares details of their approach like how they needed to have a validation set with images from different ships than the training set and how they handled night-vision images.

Because the photos from the competition’s dataset aren’t publicly releasable, the team’s recruited graphic designer Jurgita Avišansytė to contribute illustrations for this blog post.

The basics:

What was your background prior to entering this challenge?

P.: BA Mathematics (University of Cambridge), about 2 years of experience as a data scientist/consultant, about 1.5 years a software engineer, about 1.5 years of experience with object detection research and frameworks as a research engineer working on surveillance applications.

N.: Mathematics BS, Computer Science MS and 3 years of R&D work, including around 9 months of being the research lead for a surveillance project.

B.: Software Engineering BS, Computer Science MS, 6 years of professional experience in computer vision and ML, currently studying astrophysics where I also apply deep learning methods.

Do you have any prior experience or domain knowledge that helped you succeed in this competition?

P.: Yes. Research experience at my job and intuition gained from last Kaggle competition also helped (i.e., to invest the first week into building a reasonable validation method).

N.: Yes, what helped was a combination of studying in university (mostly self studying), R&D work experience, previous two Kaggle Computer Vision competitions, chilling in arxiv daily, etc.

B.: Yes. My MS thesis was on the topic of deep learning and I have some previous Kaggle experience. I’m also solving computer vision problems regularly at work.

How did you get started competing on Kaggle?

P.: I first heard about Kaggle during my first year as a data scientist, but started considering it seriously a few years later, after I transitioned into computer vision. It provides an opportunity to focus on slightly different problems/data sets and efficiently validate distinct approaches.

N.: I used to enjoy competing in algorithmic competitions such as ACM ICPC. I didn’t achieve anything too significant (had a Master rank for a short while on a popular site codeforces and got several Certificates of Achievement at various on-site competitions though), but traveling to international competitions as a Vilnius University team member were one of the best experiences of my student life. After I started working in Machine Learning and Computer Vision I started to enjoy long-term challenges more so Kaggle was a perfect fit.

B.: It just seemed like a natural step, since I enjoyed solving ML problems and Kaggle was THE platform to do that.

What made you decide to enter this competition?

P.: I wanted to experiment more with stacking and customising models for such purposes. I also wanted another reference point for comparing recent detection frameworks/architectures.

N.: Object detection is one of my strongest areas and this problem seemed challenging, as the imaging conditions seemed very “in the wild”.

B.: The main draw was how challenging this competition looked, especially due to the lack of good data.

Jurgita A.: The fact that the three guys above are incompetent at drawing and they needed diagrams and illustrations for this blog post.

Let's get technical:

Did any past research or previous competitions inform your approach?

Yes, Faster R-CNN proved to work very well for our previous competitions and we already had experience using and modifying it.

What supervised learning methods did you use?

We mostly used Faster R-CNN with VGG-16 as the feature extractor, even though one of the models was R-FCN with ResNet-101.

What preprocessing and data augmentations were used?

Most of the augmentation pipeline for training the models was pretty standard. Random rotations, horizontal flips, blurring and scale changes were all used and had an impact on the validation score. However, the two things that paid off the most were toying with night vision images and image colors.

We noticed early on that the night vision images were really easy to identify - simply checking if the mean of the green channel was brighter than the added means of red and blue channels, weighted by a coefficient of 0.75, worked in all of the cases we looked at. Looking at a color intensity histogram of a typical normal image and a night vision image one can clearly spot the differences, as regular images usually have distributions of colors that are pretty close to one another. This can be seen in the figures below. The dotted lines represent the best fit Gaussians that approximate these distributions.

What we wanted for augmentation was more night vision images. So one of the final models, which also happened to be the best performing single model in the end, took a random fraction of the training images and stretched their histograms to be closer to what night vision images look like. This was done for each color channel separately and assuming they’re Gaussian (even though they’re not) and simply renormalizing the means and standard deviations accordingly - which basically amounted to scaling back the red and blue channels as can be seen from the figures. Afterwards we also did random contrast stretching for each color channel separately. This was done because the night vision images themselves could be quite varied and a fixed transformation where the resulting mean and standard deviation is the same didn’t capture that variety.

Because this model worked quite well we also added a different model that doesn’t single out night vision images, but stretches the contrast of all images. Because this is done on each channel separately this could result in the fish or the surroundings changing colors. This also seemed to work really well, as the colors in real images weren’t very stable due to the varying lighting conditions in the data.

What was your most important insight into the data?

Firstly, it was essential to have a validation set that contains images from different ships than the ones in the training set, because otherwise the models could learn to classify fishes based on the ship features and this wouldn’t show up on validation scores, which could lead to dramatic accuracy drop for the stage2 test set.

Secondly, the fishes were of drastically different size throughout the dataset so handling this explicitly was useful.

Thirdly, there was a large number of night-vision images that had a different color distribution so handling the night-vision images differently improved our scores.

What is more, the additional data posted on the forums by the other teams seemed to contain a lot of images where the fishes looked too different from what a fish could possibly look like while lying on a boat, so filtering them out was important.

Lastly, we had polygonal annotations for the original training images, which we believe helped us achieve more accurate bounding boxes on rotated images, as they would have included a lot of background otherwise (if a bounding box of the rotated box was taken as ground truth).

Which tools did you use?

We used a customized py-R-FCN (which includes Faster R-CNN) code starting from this repository https://github.com/Orpine/py-R-FCN.

How did you spend your time on this competition?

We spent some time annotating the data, finding useful additional data from the images posted on the forums, finding the right augmentations for training the models and looking at the generated predictions for the validation images, trying to see any false patterns the models might have learned.

What does your hardware setup look like?

2x NVIDIA GTX 1080, 1x NVIDIA TITAN X

What was the run time for both training and prediction of your winning solution?

A very rough estimate is around 50 hours on a GTX 1080 for training and 7-10 seconds for prediction for each image. Our best single model, which is actually more accurate than our whole ensemble, can be trained in 4 hours and needs 0.5 seconds for prediction.

Do you have any advice for those just getting started in data science?

Read introductory material and gradually move towards reading papers, solve Machine Learning problems that interest you and try to build an intuition about what works when by inspecting your trained models, look at the errors they make and try to understand what went wrong. Computer Vision problems are quite good for this as they are inherently visual. Most importantly, try to enjoy the process as learning Machine learning is a long-term endeavour and there is no better way to maintain motivation than to enjoy what you’re doing. Kaggle is a perfect platform for learning to enjoy learning Machine Learning.

Teamwork:

How did your team form?

We are all colleagues and we all have substantial experience in object detection.

How did competing on a team help you succeed?

We already had experience working together and we learned to complement each other well.

Just for fun:

If you could run a Kaggle competition, what problem would you want to pose to other Kagglers?

We would pose the problem that our public education system is outdated, wrong and needs to change. Because it would need to be cast as a prediction problem, we would ask Kagglers to predict when a student will most likely develop repulsion towards learning based on the time series of how much forced pseudo-learning he had to endure already.

Because Kaggle is a great platform for self-learning, we’ll share this website https://www.self-directed.org/.

What is your dream job?

Job which is self-chosen, because every job that has-to-be-done is already automatized by Machine Learning.

Intel & MobileODT Cervical Cancer Screening Competition, 1st Place Winner's Interview: Team 'Towards Empirically Stable Training'

$
0
0

In June of 2017, Intel partnered with MobileODT to challenge Kagglers to develop an algorithm with tangible, real-world impact–accurately identify a woman’s cervix type in images. This is really important because assigning effective cervical cancer treatment depends on the doctor's ability to accurately do this. While cervical cancer is easy to prevent if caught in its pre-cancerous stage, many doctors don't have the skills to reliably discern the appropriate treatment.

In this winners' interview, first place team, 'Towards Empirically Stable Training' shares insights into their approach like how it was important to invest in creating a validation set and why they developed bounding boxes for each photo.

The basics:

What was your background prior to entering this challenge?

Ignas Namajūnas (bobutis) - Mathematics BSc, Computer Science MSc and 3 years of R&D work, including around 9 months of being the research lead for a surveillance project.

Jonas Bialopetravičius (zadrras) - Software Engineering BSc, Computer Science MSc, 7 years of professional experience in computer vision and ML, currently studying astrophysics where I also apply deep learning methods.

Darius Barušauskas (raddar) – BSc & MSc in Econometrics, 7 years of ML applications in various fields, such as finance, telcos, utilities.

Do you have any prior experience or domain knowledge that helped you succeed in this competition?

We have a lot of experience in training object detectors. Additionally, Jonas and Ignas have won a previous deep learning competition - The Nature Conservancy Fisheries Monitoring Competition; It required similar know-how, therefore it could be easily transferred to this task.

How did you get started competing on Kaggle?

We saw Kaggle as an opportunity to apply our knowledge and skills obtained in our daily jobs to other fields as well. We also saw a lot of opportunity to learn from the great Machine Learning community the Kaggle platform has.

What made you decide to enter this competition?

The importance of this problem and the fact that it could be approached as object detection, where we already had success in a previous competition.

Let's get technical:

Did any past research or previous competitions inform your approach?

We have been using Faster R-CNN in many tasks we have done so far. We believe that by tuning the right details it can be adapted to quite different problems.

What preprocessing steps have you done?

Since we had a very noisy dataset, we spent lots of time manually looking at the given data. We noticed, that the additionally provided dataset had many blurry and non-informative photos. We discarded large portion of them (roughly 15%). We also hand labeled photos by creating bounding boxes with regions of interest in each photo (both original dataset and additional dataset). This was essential for our methods to work and it helped a lot during model training.

What supervised learning methods did you use?

We used a few different variants of Faster R-CNN models with VGG-16 feature extractors. In the end, we ended up with 4 models which we ensembled. These models also had complementary models for generating bounding boxes on the public test set and night-vision-like image detection. Some of these 4 models alone were enough to place us 1st.

What was your most important insight into the data?

A proper validation scheme was super important. We noticed that the additional dataset had many similar photos as in the original training set, which itself caused problems if we wanted to use additional data in our models. Therefore, we applied K-means clustering to create a trustworthy validation set. We clustered all the photos into 100 clusters and took 20 random clusters as our validation set. This helped us track if data augmentations we used in our models were useful or not.

We also saw that augmenting the red color channel was critical, therefore we used a few different red color augmentations in our models.

Having two datasets with differing quality, we also experimented with undersampling the additional dataset. We found out that keeping the original:additional dataset image count ratio to 1:2 was optimal (in contrast to a ratio of 1:4, if no undersampling was applied).

Were you surprised by any of your findings?

From manual inspection, it seems that different types of cancerous cervixes had differing blood patterns. So focusing on blood color in the photos seemed logical.

Which tools did you use?

We used our customized R-FCN (which also includes Faster R-CNN). Original version can be obtained at https://github.com/Orpine/py-R-FCN.

How did you spend your time on this competition?

The first few days were dedicated to creating image bounding boxes and thinking of how to construct a proper validation set. After that we kept our GPU’s running non-stop while discussing which data augmentations we should try.

What does your hardware setup look like?

We had 2 GTX1080 and 1 GTX980 for model training. The whole ensemble takes 50 hours to train and it takes 7-10 seconds for single image inference. Our best single model takes 8 hours to train, 0.7 seconds for image inference.

Words of wisdom:

Many different problems could be tackled using the same DL algorithms. If a problem can be interpreted as an image detection problem, detecting fish types or certain cervix types becomes somewhat equivalent, even though knowing which details to tune for each problem might be very important.

Teamwork:

How did your team form?

We have been colleagues and acquaintances for a long time. On top of that, we are a part of larger team, aiming to solve medical tasks with computer vision and deep learning.

How did your team work together?

We were using slack for communication and had a few meetings as well.

How did competing on a team help you succeed?

It was much easier as we could split roles. Darius worked on image bounding boxes and setting up the validation, Jonas worked on the codebase, and Ignas was brainstorming which data augmentations to test.

Just for fun:

If you could run a Kaggle competition, what problem would you want to pose to other Kagglers?

Given the patient medical records, X-rays, ultrasounds, etc. predict which disease a patient is likely to suffer in the future. Combining different sources of information sounds like an interesting challenge.

What is your dream job?

Creating deep-learning based software for doctors to assist them in faster and more accurate decisions and more efficient patient treatment.

August Kaggle Dataset Publishing Awards Winners' Interview

$
0
0

In August, over 350 new datasets were published on Kaggle, in part sparked by our $10,000 Datasets Publishing Award. This interview delves into the stories and background of August's three winners–Ugo Cupcic, Sudalai Rajkumar, and Colin Morris. They answer questions about what stirred them to create their winning datasets and kernel ideas they'd love to see other Kagglers explore.

If you're inspired to publish your own datasets on Kaggle, know that the Dataset Publishing Award is now a monthly recurrence and we'd love for you to participate. Check out this page for more details.

First Place, Grasping Dataset by Ugo Cupcic

Can you tell us a little about your background?

I’m the Chief Technical Architect at the Shadow Robot company. I joined Shadow in 2009 after working briefly for a consulting firm in London. I joined Shadow as a software engineer when it was still a very small company. I then evolved as the needs of the company diversified while growing - senior software engineer, head of software and finally CTA. My background is in bio-informatics (!) and AI. Feel free to connect on Linkedin if you want to know more.

What motivated you to share this dataset with the community on Kaggle?

I had no idea there was a prize! At Shadow, we have a strong open source culture. As you can see on github, we share as much of our code as we can. We’re also active in the ROS community. It was then logical for us to share this dataset.

I was personally very keen to step into the Kaggle community. For someone who is more of a roboticist than a pure Machine Learning person, Kaggle seems to be the de facto platform for sharing ML problems, datasets, etc. I’m always looking to get fresh ideas from people who’re working on relevant fields, but can be outside of robotics.

What have you learned from the data?

It’s a first delve into using machine learning to robustly predict a grasp stability. The dataset can’t be used to deploy the trained algorithm on a real robot (yet). We’d have to invest more efforts in a more robust simulation for grasping before this would happen.

Determining whether a grasp will succeed or fail before you lift the object - or before the object falls is a hot topic. In the video below, you can see the live grasp prediction working in the simulated sandbox. Grasp stability measurement is well studied in robotics, but it often assumes having a good knowledge of the object you’re grasping and its relation to the robot. My goal is to see how far we can go without this.

If you want the full details behind the dataset  you should take a look at my associated Medium story.

What questions would you love to see answered or explored in this dataset?

There’s the obvious question: how can I predict accurately whether my grasp will fail or succeed given that dataset. I’m definitely interested in learning more about your ideas on how to tackle it as a machine learning problem.

The other questions I’m very interested in is what sort of data would you like to have in order to build a better prediction algorithm?

So don’t hesitate to get in touch, either on Kaggle or on twitter!


Second Place, Cryptocurrency Historical Prices by Sudalai Rajkumar

Can you tell us a little about your background?

I am Sudalai Rajkumar (aka SRK) working as a Lead Data Scientist with Freshworks. I did my graduation from PSG college of Technology and Professional certification in Business Analytics from IIM Bangalore. I have been in the Data Science field right from the start of my career and doing Kaggle for almost five years now.

What motivated you to share this dataset with the community on Kaggle?

I was hearing a lot of buzz about cryptocurrencies and wanted to explore this field. I initially thought Bitcoin was the only cryptocurrency available. But when I started exploring it, I came to know that there are hundreds of cryptocurrencies available.

So, I was looking for datasets to understand more about them (at least the top 15-20 cryptocurrencies). I was able to find datasets for Bitcoin and Ethereum, but not for others on the internet at all. I thought this dataset would be useful for me, then it would be useful for others too and so I shared it. Thanks to Coin Market Cap, I was able to get the historical data for all these different currencies.

My next thought was to understand the price drivers of these coins. There are so many features of a block chain, like number of transactions (which affect the waiting time for the transactions to get confirmed), difficulty level of mining a new coin (which incentivizes the miners), etc., which could bear an effect on the prices of altcoins. I was able to get these details for Bitcoin (thanks to Blockchain Info) and Ethereum (thanks to EtherScan).

What have you learned from the data?

I learned a lot about Cryptocurrencies through this exercise. I was completely new to this crypto world when I started this exploration. Now I have got more idea about how they work, what are the different top cryptocurrencies etc.

Also I got to know about the high price volatility of these currencies from this data, which makes them highly risky but at the same time highly rewarding if we choose the right one. Hoping to make some investments now with the prize money 😉

What questions would you love to see answered or explored in this dataset?

Some interesting answers / explorations could be

At individual coin level

  1. Price volatility of the coins
  2. Seasonal trends in the coins, if any
  3. Predicting the future price. A good attempt based on NNs can be seen here.
  4. Effect of other parameters on the price (for Bitcoin and Ethereum)

At the overall level

  1. How does the price changes of the coins compare with each other. One good kernel on this could be seen here.
  2. How does the market cap of individual ones changed over time.

Third Place, Favicons by Colin Morris

Can you tell us a little about your background?

I studied computer science at the University of Toronto and did a master's in computational linguistics. After university, I worked for about 3 years at Apple on a team that did AI-related iOS features. Since leaving Apple, I've enjoyed flitting around working on weird personal projects (most of them involving data science in some way).

What motivated you to share this dataset with the community on Kaggle?

I see a lot of potential in it for experiments in unsupervised deep learning, particularly when working with limited hardware or time. There's a classic image dataset called MNIST which is the go-to if you're making a deep learning tutorial, or benchmarking some new technique. It consists of 70,000 images of handwritten digits, downscaled to 28x28 pixels. The images in the favicon dataset are also tiny, but the great thing about them is that they're naturally tiny. The 290,000 16x16 images in the dataset were designed to be viewed at that size.

What have you learned from the data?

I've learned that, while most sites follow the convention of having square favicons that are somewhere between 16x16 and 64x64, there are plenty of weird exceptions. I published a kernel where you can see some of the most extreme examples. Aesthetically, my favourites are the ones that are smaller than 10x10. I think they belong in MoMA.

As a result of sharing the dataset around, I also learned that my idea wasn't as unique as I'd thought. Shortly after I published the favicon dataset, some researchers from ETH Zurich released a sneak peek of their own 'Large Logo Dataset', along with some really cool preliminary results from training a neural network to generate new icons. (When I shared a link to the dataset on Twitter, I semi-jokingly suggested that "someone should train a GAN on these". I was tickled when I got a reply from one of the researchers saying "We did!").

What questions would you love to see answered or explored in this dataset?

I think the most interesting application of the data is in training generative machine learning models - i.e. teaching models to draw new favicons after seeing many examples. Generative models have been a hot area in machine learning recently, with some new architectures coming out that have showed very impressive results. But most of the work has been applied to natural, photographic images (recent work with Google's QuickDraw doodle dataset is a very cool exception). I'm very interested in how well these generative models deal with non-photographic images. These have much less detail than photographs, but on the other hand, there's the difficulty of dealing with a variety of different art styles and different subjects depicted.

I think it's also ripe for cool visualizations. Someone on twitter made a beautiful mosaic of the first 1,000 images in the dataset, arranged by colour. I'd love to see more stuff like that - perhaps using some different clustering methods.

Instacart Market Basket Analysis, Winner's Interview: 2nd place, Kazuki Onodera

$
0
0

Our recent Instacart Market Basket Analysis competition challenged Kagglers to predict which grocery products an Instacart consumer will purchase again and when. Imagine, for example, having milk ready to be added to your cart right when you run out, or knowing that it's time to stock up again on your favorite ice cream.

This focus on understanding temporal behavior patterns makes the problem fairly different from standard item recommendation, where user needs and preferences are often assumed to be relatively constant across short windows of time. Whereas Netflix might be fine assuming you want to watch another movie similar to the one you just watched, it's less clear that you'll want to reorder a fresh batch of almond butter or toilet paper if you bought them yesterday.

We interviewed Kazuki Onodera (aka ONODERA on Kaggle), a data scientist at Yahoo! JAPAN, to understand how he used complex feature engineering, gradient boosted tree models, and special modeling of the competition's F1 evaluation metric to win 2nd place.

Basics

What was your background prior to entering this challenge?

I studied Economics in university, and I worked as a consultant in the financial industry for several years. In 2015, I won 2nd place in the KDD Cup 2015 challenge, where the goal of the challenge was to predict the probability that a student would drop out of a course in 10 days. Now I work as a data scientist for Yahoo! JAPAN.

How did you get started competing on Kaggle?

I joined Kaggle about 2 years ago after one of my colleagues mentioned it to me. My first competition was the Otto Product Classification Challenge. Since the features in that challenge were obfuscated, I couldn't perform any exploratory data analysis or feature engineering, unlike what I did here.

What made you decide to enter this competition?

First, I like e-commerce. I’m currently in charge of auction services at Yahoo! JAPAN.

Second, this competition seemed to have clean data, and I thought that there might be a lot of room for feature engineering. I believe my strength is feature engineering, so I thought I'd be able to achieve good results with this kind of data.

Diving Into The Solution

Problem Overview

The goal of this competition was to predict grocery reorders: given a user’s purchase history (a set of orders, and the products purchased within each order), which of their previously purchased products will they repurchase in their next order?

The problem is a little different from the general recommendation problem, where we often face a cold start issue of making predictions for new users and new items that we’ve never seen before. For example, a movie site may need to recommend new movies and make recommendations for new users.

The sequential and time-based nature of the problem also makes it interesting: how do we take the time since a user last purchased an item into account? Do users have specific purchase patterns, and do they buy different kinds of items at different times of the day? And the competition’s F1 evaluation metric makes sure our models have both high precision and high recall.

Main Approach

I used XGBoost to create two gradient boosted tree models:

  1. Predicting reorders - which previously purchased products will be in the next order? This model depends on both the user and product.
  2. Predicting None - will the user’s next order contain any previously purchased products? This model only depends on the user.

Here is a diagram of the model flow.

In words:

  • The reorder prediction model uses XGBoost to create six different gradient boosted tree models (each GBDT uses a different random seed). I average their predictions together to get the probability that User A will repurchase Item B in their next order.
  • The None prediction model uses XGBoost to create seventeen different models. 11 of these use an eta parameter (a step size shrinkage) set to 0.01, and the others use an eta parameter set to 0.002. I take a weighted average of these predictions to get the probability that User A won’t repurchase any items in their next order.
  • To convert these probabilities into binary Yes/No scores of which items User A will repurchase in their next order, I feed them into a special F1 Score Maximization algorithm that I created, detailed below.

Exploratory Data Analysis

Let's explore the data a little.

How hot are users? How many orders do they make?

How hot are items? How often are they ordered?

Data Augmentation

One of my thoughts was that more data would help me make better predictions. Thus, I decided to augment the amount of data I could train on.

We were given three datasets:

  • A "prior" dataset containing user purchase histories.
  • Training and test datasets consisting of future orders that we could train and test our models on.

Rather than training my model only on the provided training set, I increased the amount of training data available to me by adding in each user's 3 most recent orders as well.

This is best illustrated by the figure below.

Instead of only using the provided training set (“tr”), I also looked a short window back in time (the cells shaded in yellow) to gather more data.

Feature Engineering

I created four types of features:

  1. User features - what is this user like?
  2. Item features - what is this item like?
  3. User x item features - how does this user feel about this item?
  4. Datetime features - what is this day and hour like?

Here are some of the ideas behind the features I created.

User features

  • How often the user reordered items
  • Time between orders
  • Time of day the user visits
  • Whether the user ordered organic, gluten-free, or Asian items in the past
  • Features based on order sizes
  • How many of the user’s orders contained no previously purchased items

Item features

  • How often the item is purchased
  • Position in the cart
  • How many users buy it as "one shot" item
  • Stats on the number of items that co-occur with this item
  • Stats on the order streak
  • Probability of being reordered within N orders
  • Distribution of the day of week it is ordered
  • Probability it is reordered after the first order
  • Statistics around the time between orders

User x Item features

  • Number of orders in which the user purchases the item
  • Days since the user last purchased the item
  • Streak (number of orders in a row the user has purchased the item)
  • Position in the cart
  • Whether the user already ordered the item today
  • Co-occurrence statistics
  • Replacement items

Datetime features

  • Counts by day of week
  • Counts by hour

For a full list of all the features I used and how they were generated, see my Github repository.

Which features were the most useful?

For the reorder prediction model, we can see that the most important features were...

To explain the top features:

  • total_buy_n5(User A, Item B) is the total number of times User A bought Item B out of the 5 most recent orders.
  • total_buy_ratio_n5 is the proportion of A's 5 most recent orders in which A bought B.
  • useritem_order_days_max_n5, described in more detail below, captures the longest that A has recently gone without buying B.
  • order_ratio_by_chance_n5 captures the proportion of recent orders in which A had the chance to buy B, and did indeed do so. (A "chance" refers to the number of opportunities the user had for buying the item after first encountering it. For example, if a user A had order numbers 1-5, and bought item B at order number 2, then the user had 4 chances to buy the item, at order numbers 2, 3, 4, and 5.)
  • useritem_order_days_median_n5 is the median number of days that A has recently gone without buying B.

(Note: the suffix "_n5" means "near5", i.e., features extracted from the 5 most recent orders.)

For the None prediction model, the most important features were…

  • useritem_sum_pos_cart-mean(User A) is described in more detail below, and is a kind of measure of whether the user tends to buy a lot of items at once.
  • total_buy-max is the maximum number of times the user has bought any item.
  • total_buy_ratio_n5-max is the maximum proportion of the 5 most recent orders in which the user bought a certain item. For example, if there was an item the user bought in 4 out of their 5 most recent orders, but no other item more often than that, this feature would be 0.8.
  • total_buy-mean is the mean number of times the user has bought any item.
  • t-1_reordered_ratio is the proportion of items in the previous order that were repurchases.

Insights

Here were some of my most important insights into the problem.

Important Finding for Reorders - #1

Let’s think about the reordering problem. Common sense tells us that an item purchased many times in the past has a high probability of being reordered. However, there may be a pattern for when the item is not reordered. We can try to figure out this pattern and understand when a user doesn’t repurchase an item.

For example, consider the following user.

This user pretty much always orders Cola. But at order number 8, the user didn’t. Why not? Probably because the user bought Fridge Pack Cola instead.

So I created features to capture this kind of behavior.

Important Finding for Reorders - #2

Days_since_last_order_this_item(User A, Item B) is a feature I created that measures the number of days that have passed since User A last ordered Item B.

Useritem_orders_days_max(User A, Item B) is the maximum of the above feature across time, i.e., the longest that User A has ever gone without ordering B.

Days_last_order-max(User A, Item B) is the difference between these two features. So this feature tells us how ready the user is to repurchase the item.

Indeed, if we plot the distribution of the feature, we can see that it’s highly predictive of our target value.

Important Finding for Reorders - #3

We already know that fruits are reordered more frequently than vegetables (see 3 Million Instacart Orders, Open Sourced). I wanted to know how often, so I made a item_10to1_ratio feature that’s defined as the reorder ratio after an item is ordered vs. not ordered.

Important Finding for None - #1

Useritem_sum_pos_cart(User A, Item B) is the sum across orders of the position in User A’s cart that Item B falls into.

Useritem_sum_pos_cart-mean(User A) is the mean of the above feature across all items.

This feature says that users who don't buy many items all at once are more likely to be None.

Important Finding for None - #2

Total_buy-max(User A) is the total number of times User A has purchased any item. We can see that it predicts whether or not a user will make a reorder.

Important Finding for None - #3

t-1_is_None(User A) is a binary feature that says whether or not the user’s previous order was None (i.e., contained no reordered products).

If the previous order is None, then the next order will also be None with 30% probability.

F1 Maximization

In this competition, the evaluation metric was an F1 score, which is a way of capturing both precision and recall in a single metric.

Thus, instead of returning reorder probabilities, we need to convert them into binary 1/0 (Yes/No) numbers.

In order to perform this conversion, we need to know a threshold. At first, I used grid search to find a universal threshold of 0.2. However, then I saw comments on the Kaggle discussion boards suggesting that different orders should have different thresholds.

To understand why, let’s look at an example.

Take the order in the first row. Let’s say our model predicts that Item A will be reordered with 0.9 probability, and Item B will be reordered with 0.3 probability. If we predict that only A will be reordered, then our expected F1 score is 0.81; if we predict that only B will be reordered, then our expected F1 score is 0.21; and if we predict that both A and B will be reordered, then our expected F1 score is 0.71.

Thus, we should predict that Item A and only Item A will be reordered. This will happen if we use a threshold between 0.3 and 0.9.

Similarly, for the order in the second row, our optimal choice is to predict that Items A and B will both be reordered. This will happen is long as the threshold is less than 0.2 (the probability that Item B will be reordered).

What this illustrates is that each order should have its own threshold.

Finding Thresholds

How do we determine this threshold? I wrote a simulation algorithm as follows.

Let’s say our model predicts that Item A will be reordered with probability 0.9, and Item B with probability 0.3. I then simulate 9,999 target labels (whether A and B will be ordered or not) using these probabilities. For example, the simulated labels might look like this.

I then calculate the expected F1 score for each set of labels, starting from the highest probability items, and then adding items (e.g., [A], then [A, B], then [A, B, C], etc) until the F1 score peaks and then decreases.

Predicting None

One way to think about None is as the probability (1 - Item A) * (1 - Item B) * …

But another method is to try to predict None as a special case. By creating a None model and treating None as just another item, I was able to boost my F1 score from 0.400 to 0.407.

Words of wisdom

What have you taken away from this competition?

All metrics can be hacked, I think. Especially metrics where we have to convert probabilities to binary scores. (Although metrics like AUC are rarely hacked.)

Do you have any advice for those just getting started in data science?

Join the competitions you like. But never give up before the end, and try every approach you come up with. I know it’s a tradeoff between sleep and your leaderboard ranking. It’s common for features that take a lot of time to construct to wind up doing nothing. But we can’t know the result if we don't do anything. So the most important thing is to participate in the delusion that you’ll get a better result if you try!

Planet: Understanding the Amazon from Space, 1st Place Winner's Interview

$
0
0

In our recent Planet: Understanding the Amazon from Space competition, Planet challenged the Kaggle community to label satellite images from the Amazon basin, in order to better track and understand causes of deforestation.

The competition contained over 40,000 training images, each of which could contain multiple labels, generally divided into the following groups:

  • Atmospheric conditions: clear, partly cloudy, cloudy, and haze
  • Common land cover and land use types: rainforest, agriculture, rivers, towns/cities, roads, cultivation, and bare ground
  • Rare land cover and land use types: slash and burn, selective logging, blooming, conventional mining, artisanal mining, and blow down

We recently talked to user bestfitting, the winner of the competition, to learn how he used an ensemble of 11 finely tuned convolutional nets, models of label correlation structure, and a strong focus on avoiding overfitting, to achieve 1st place.

Basics

What was your background prior to entering this challenge?

I majored in computer science and have more than 10 years of experience programming in Java and working on large-scale data processing, machine learning, and deep learning.

Do you have any prior experience or domain knowledge that helped you succeed in this competition?

I entered a few deep learning competitions on Kaggle this year. The experiences and the intuition I gained helped a lot.

How did you get started competing on Kaggle?

I’ve been reading a lot of books and papers about machine learning and deep learning since 2010, but I always found it hard to apply the algorithms I learned on the kinds of small datasets that are usually available. So I found Kaggle a great platform, with all the interesting datasets, kernels, and great discussions. I couldn’t wait to try something, and entered the “Predicting Red Hat Business Value” competition last year.

What made you decide to enter this competition?

I entered this competition for two reasons.

First, I’m interested in nature conservation. I think it’s cool to use my skills to make our planet and life better. So I’ve entered all the competitions of this kind that Kaggle has hosted this year. And I’m especially interested in the Amazon rainforest since it appears so often in films and stories.

Second, I’ve entered all kinds of deep learning competitions on Kaggle using algorithms like segmentation and detection, so I wanted a classification challenge to try something different.

Let's Get Technical

Can you introduce your solution briefly first?

This is a multi-label classification challenge, and the labels are imbalanced.

It’s a hard competition, as image classification algorithms have been widely used and built upon in recent years, and there are many experienced computer vision competitors.

I tried many kinds of popular classification algorithms that I thought might be helpful, and based on careful analysis of label relationships and model capabilities, I was able to build an ensemble method that won 1st place.

This was my model’s architecture:

In words:

  • First, I preprocessed the dataset (by resizing the images and removing haze), and applied several standard data augmentation techniques.
  • Next, for my models, I fine-tuned 11 convolutional neural networks (I used a variety of popular, high-performing CNNs like ResNets, DenseNets, Inception, and SimpleNet) to get a set of class label probabilities for each CNN.
  • I then passed each CNN’s class label probabilities through its own ridge regression model, in order to adjust the probabilities to take advantage of label correlations.
  • Finally, I ensembled all 11 CNNs, by using another ridge regression model.
  • Also of note is that instead of using a standard log loss as my loss function, I used a special soft F2-loss in order to get a better score on the F2 evaluation metric.

What preprocessing and feature engineering did you do?

I used several preprocessing and data augmentation steps.

  • First, I resized images.
  • I also added data augmentation by flipping, rotating, transposing, and elastic transforming images in my training and test sets.
  • I also used a haze removal technique, described in this “Single Image Haze Removal using Dark Channel Prior” paper, to help my networks “see” the images more clearly.

Here are some examples of haze removal on the dataset:

As we can see in the following chart, haze removal improved the F2 score of some labels (e.g., water and bare_ground), but decreased the F2 score of others (e.g., haze and clear). However, this was fine since ensembling can select the strongest models for each label, and the haze removal trick helped overall.

What supervised learning methods did you use?

The base of my ensemble consisted of 11 popular convolutional networks: a mixture of ResNets and DenseNets with different numbers of parameters and layers, as well an Inception and SimpleNet model. I fine-tuned all layers of these pre-trained CNNs after replacing the final output layer to meet the competition's output, and I didn't freeze any layers.
The training set consisted of 40,000+ images, so would have been large enough to even train some of these CNN architectures from scratch (e.g., resnet_34 and resnet_50), but I found that fine-tuning the weights of the pre-trained network performed a little better.

Did you use any special techniques to model the evaluation metric?

Submissions were evaluated on their F2 score, which is a way of combining precision and recall into a single score – like the F1 score, but with recall weighted higher than precision. Thus, we needed not only to train our models to predict label probabilities, but also had to select optimum thresholds to determine whether or not to select a label given its probability.

At first, like many other competitors, I used log loss as my loss function. However, as the chart below shows, lower log losses don’t necessarily lead to higher F2 scores.

This means we should find another kind of loss function that allows our models to pay more attention to optimizing each label’s recall. So with the help of code from the forums, I wrote my own Soft F2-Loss function.

This did indeed improve the overall F2 score, and in particular, the F2 score of labels like agriculture, cloudy, and cultivation.

What was your most important insight into the data and models?

I analyzed the correlation between labels, and found that certain labels coexist quite frequently, whereas others do not. For example, the clear, partly cloudy, cloudy, and haze labels are disjoint, but habitation and agriculture labels appear together quite frequently. This meant that making use of this correlation structure would likely improve my model.

For example, let’s take my resnet-101 model. This predicts probabilities for each of the 17 labels. In order to take advantage of label correlations, though, I added another ridge-regularized layer to recalibrate each label probability given all the others.

In other words, to predict the final clear probability (from the resnet-101 model alone), I have a specific clear ridge regression model that takes in the resnet-101 model’s predictions of all 17 labels.

How did your ensemble your models?

After we get predictions from all N models, we have N probabilities of the clear label from N different models. We can use them to predict the final clear label probability, by using another ridge regression.

This kind of two-level ridge regression does two things:

  1. First, it allows us to use the correlation information among the different labels.
  2. It allows us to select the strongest models to predict each label.

Were you surprised by any of your findings?

Even though I’d predicted the final shakeup of the leaderboard (where the public and private leaderboard scores differed quite a bit), I was still surprised.

Essentially, at the last stage of the competition (10 days before the end), I found that the public scores were very close, and I couldn’t improve my local cross-validation or public scores any more. So I warned myself to be careful to avoid overfitting on what could just be label noise.

To understand this pitfall better, I simulated the division into public and private leaderboards by using different random seeds to select half of the training set images as new training sets. I found that as the seed changed, the difference between my simulated public and private scores could grow up to 0.0025. But the gap between the Top 1 and Top 10 entries on the public leaderboard was smaller than this value.

This meant that a big shakeup could very likely happen in the real competition as well.

After carefully analyzing, I found that this kind of variation arose with difficult images where labels were prone to confusion from humans as well, like whether an image should be labeled haze vs. cloudy, road vs. water, or blooming vs. selective logging.

Because of this, I persuaded myself that the public leaderboard scores weren’t a perfect metric of model capability. This was unexpected: since the public test set contains 40,000+ images, it seems like the leaderboard should be pretty stable.

So I adjusted my goal to simply keep myself in the top 10, and decided not to care about my exact position on the public leaderboard in the last week. Instead, I tried to find the most stable way to ensemble my models, I threw away any models that would likely lead to overfitting, and in the end I used voting and ridge regression.

Why so many models?

The answer is simple: diversity.

I don’t think the number of models is a big problem, for several reasons:

  1. First, if we want a simple model, we can simply choose 1-2 of them, and it will still get a decent score on both the public and private leaderboards (top 20).
  2. Second, we have 17 labels, and different models have different capabilities on each label.
  3. Third, our solution will be used to replace or simplify the human labeling job. Since computational resources are relatively cheaper than humans, we can predict unlabeled images by using strong models, modify any incorrectly predicted images, and then use the expanded data set to train stronger or simpler models iteratively.

What tools did you use?

Python 3.6, PyTorch, PyCharm community version.

What does your hardware setup look like?

A server with four NVIDIA GTX TITAN X Maxwell GPUs.

Words of wisdom

What have you taken away from this competition?

As we discussed above, I found that using a soft F2-loss function, adding a haze-removal algorithm, and applying two-level ridge regression were important in achieving good scores.

Also, due to label noise, we must trust our local cross-validation.

Do you have any advice for those just getting started in data science?

  1. Learn from good courses like Stanford’s CS229 and CS231n.
  2. Learn from Kaggle competitions, kernels, and starter scripts.
  3. Enter Kaggle competitions and use them to get feedback.
  4. Read papers everyday and implement some of them.

October Kaggle Dataset Publishing Awards Winners' Interview

$
0
0

This interview features the stories and backgrounds of the October winners of our $10,000 Datasets Publishing Award–Zeeshan-ul-hassan UsmaniEtienne Le Quéré, and Felipe Antunes. If you're inspired to contribute a dataset and compete for next month's prize, check out this page for more details.

First Place, US Mass Shootings - Last 50 Years (1966-2017) by Zeeshan-ul-hassan Usmani

Can you tell us a little about your background?

I am a freelance A.I and Data Science consultant. I have a Masters and a Ph.D. in Computer Science from Florida Institute of Technology. I've worked with the United Nations, Farmer's Insurance, Wal-Mart, Best Buy, 1-800-Flowers, Planned Parenthood, Vicrtoria's Secret, MetLife, SAKS Analytics, North Carolina Health Department and some other small companies, governments, and universities in the US, Pakistan, Canada, United Kingdom, Lithuania, China, Bangladesh, Ireland, Sri Lanka and the Middle East. Currently, I am working on a few consulting assignments regarding the government's use of AI in a cyber-connected world. Here are two of my CNN interviews on the power of datasets and who is joining ISIS. I've recently published a book called Kaggle for Beginners. I have one wife, four boys, two cats and a lovely dog.

What motivated you to share this dataset with the community on Kaggle?

I’ve started flirting with datasets during my Master’s thesis on crowd’s behavior to increase sales, and since then it’s been a continuous affair. I have posted a few datasets in the recent past on Kaggle on Pakistan Drone Attacks, Pakistan Suicide Bombing Attacks, My Uber Drives and My Complete Genome and was surprised to see the results. Altogether, my datasets received close to 7,000 downloads, 123 Kernels, and dozens of comments and forks. I witness the power of a crowdsourced data science community and thought it should be used for a noble cause. The recent mass shootings at Las Vegas concert was a heartbreaker and the first thing that came to mind was how to use Kaggle's data science community to solve or at least understand this issue that is going epidemic in the United States.

What have you learned from the data?

Quite a few things. I see a huge gap in definition and transparency to report such events. Multiple sources report wildly different number of mass shooting incidents in the United States. I went with the FBI’s definition of mass shooting when four or more people got killed or injured. Contrary to popular believe, I also found a good number of white shooters and people with mental health problems (it tells us that these incidents are preventable if we can predict in advance). The dataset also gives me the confidence to use external data sources which may not be considered related to the untrained eye. For example, the correlation with mass shooters and domestic violence or their gaming profiles.

What questions would you love to see answered or explored in this dataset?

I see a lot of good Kernels out there, for example, this Kernel did a wonderful job on an exploratory data analysis, but what I really would like to see is to combine this dataset with external data sources to see if there are any correlations or if there is a way to predict and protect from future attacks. Examples include, other datasets on gun ownership to Federal and State laws and from medical reports to traffic convictions.

Second Place, French Employment, Salaries, Population per Town by Etienne LQ (Etienne Le Quéré)

Can you tell us a little about your background?

I am Etienne, a 23 years old french student who just graduated from engineering school with a master's degree in Operational Research. I'm going to start a PhD in Operational Research soon.

What motivated you to share this dataset with the community on Kaggle?

To help a friend with her job search, I wanted to build an interactive map to highlight where big firms were in France. When I realized that the community liked the piece of dataset I provided, I increased its size with other files to help Kaggler discover the richness of INSEE (France's National Institute of Statistics and Economic Studies).

What have you learned from the data?

Nothing very surprising :

  • Big firms are in/around big cities and so are big salaries.
  • Sadly salary inequality between men and women in France is still pretty obvious and increase with the job’s qualification and the experience of the employee.

Third Place, Electoral Donations in Brazil by FelipeLeiteAntunes (Felipe Antunes)

Can you tell us a little about your background?

I’m a Senior Data Scientist at Itaú-Unibanco, the largest financial conglomerate in the southern hemisphere. I joined Itaú-Unibanco last year after starting and closing two startups and working for another startup as a lead data scientist. Also, I’m a PhD candidate in physics and my thesis is entitled "Data Science Applications to the Government Sector". My main interests are machine learning methods in complex networks, with a focus on fraud detection. Recently, I was invited to do live coding on Udacity and used Porto Seguro’s Competition as a case of study.  In the past, I was Global Shaper and a TEDx organizer.

What motivated you to share this dataset with the community on Kaggle?

I didn't even know about the prize when I posted the Electoral Donations Dataset. It’s part of my PhD research, regarding the investigation of anomalies in donations made during Brazil’s last elections. There are a lot of accusations that donations have a central role in elections (you can read a few here and here). Using this dataset, I’m able to measure the impact of donations on the electoral results, and determine if there's evidence of fraud using Benford’s law. This is the subject of a paper submitted to Physica A and part of this kernel. More developments can be found on my Github.

What have you learned from the data?

Applying well established statistical techniques and results to data concerning Brazil’s election campaign's financing and results, it's possible to identify strong evidence that democratic principles are corrupted: the determining factor on whether a candidate is elected is the amount of money donated to them. There's strong evidence that fraud has been committed in the financial declarations made by the players. If fraud has been committed in these declarations, it is not possible to really determine how the money came to the candidates and therefore it is impossible to know which interests they will be defending once elected.

What questions would you love to see answered or explored in this dataset?

Here are a couple of questions I'd love to see answered:

  • Since we know that the money affects the election results and fraud has been committed in these declarations, could we indicate who are the suspects?
  • Who donated to him, and finally, what was their interests (maybe this other dataset could help)?

Carvana Image Masking Challenge–1st Place Winner's Interview

$
0
0

This year, Carvana, a successful online used car startup, challenged the Kaggle community to develop an algorithm that automatically removes the photo studio background. This would allow Carvana to superimpose cars on a variety of backgrounds. In this winner's interview, the first place team of accomplished image processing competitors named Team Best[over]fitting, shares in detail their winning approach.

Basics

As it often happens in the competitions, we never met in person, but we knew each other pretty well from the fruitful conversations about Deep Learning held on the Russian-speaking Open Data Science community, ods.ai.

Although we participated as a team, we worked on 3 independent solutions until merging 7 days before the end of the competition. Each of these solutions were in the top 10–Artsiom and Alexander were in 2nd place and Vladimir was in 5th. Our final solution was a simple average of three predictions. You can also see this in the code that we prepared for organizers and released on GitHub–there are 3 separate folders:

Each of us spent about two weeks on this challenge, although to fully reproduce our solution on a single Titan X Pascal one would need about 90 days to train and 13 days to make predictions. Luckily, we had around 20 GPUs at our disposal. In terms of software, we used PyTorch as a Deep Learning Framework, OpenCV for image processing and imgaug for data augmentations.

What were your backgrounds prior to entering this challenge?

Vladimir Iglovikov

My name is Vladimir Iglovikov. I got Master’s degree in theoretical High Energy Physics from St. Petersburg State University and a Ph.D. in theoretical condensed matter physics from UC Davis. After graduation, I first worked at a couple of startups where my everyday job was heavy in the traditional machine learning domain. A few months ago I joined Lyft as a Data Scientist with a focus on computer vision.

I've already competed in several image segmentation competitions and the acquired experience was really helpful with this problem. Here are my past achievements:

This challenge looked pretty similar to the above problems and initially I didn't plan on participating. But, just for a sanity check I decided to make a few submissions with copy-pasted pipeline from the previous problems. Surprisingly, after a few tries I got into the top 10 and the guys suggested a team to merge. In addition, Alexander enticed me by promising to share his non-UNet approach, that consumed less memory, converged faster and was presumably more accurate.

In terms of hardware, I had 2 machines at home, one for prototyping with 2 x Titan X Pascal and one for heavy lifting with 4 x GTX 1080 Ti.

Alexander Buslaev

My name is Alexander Buslaev. I graduated from ITMO University, Saint-Petersburg, Russia. I have 5 years experience in classical computer vision and worked in a number of companies in this field, especially in UAV. About a year ago I started to use deep learning for various tasks in image processing - detection, segmentation, labeling, regression.

I like computer vision competitions, so I also took part in:

Artsiom Sanakoyeu

My name is Artsiom Sanakoyeu. I got my Master’s degree in Applied Mathematics and Computer Science from Belarusian State University, Minsk, Belarus. After graduation, I started my Ph.D. in Computer Vision at Heidelberg University, Germany.

My main research interests lie at the intersection of Computer Vision and Deep Learning, in particular Unsupervised Learning and Metric Learning. I have publications in top-tier Computer Vision / Deep Learning conferences such as NIPS and CVPR.

For me, Kaggle is a place to polish my applied skills and to have some competitive fun. Beyond Carvana, I took part in a couple of other computer vision competitions:

Diving Into The Solution

Problem Overview

The objective of this competition was to create a model for binary segmentation of high-resolution car images.

  • Each image has resolution 1918x1280.
  • Each car presented in 16 different fixed orientations:

  • Train set: 5088 Images.
  • Test set: 1200 in Public, 3664 in Private, 95200 were added to prevent hand labeling.

Problems with the Data

In general, the quality of the competition data was very high, and we believe that this dataset can potentially be used as a great benchmark in the computer vision community.

The score difference between our result (0.997332) and the second place (0.997331) result was only 0.00001, which can be interpreted as an average 2.5-pixel improvement per 2,500,000-pixel image. To be honest, we just got lucky here. When we prepared the solution for the organizers, we invested some extra time and improved our solution to 0.997343 on the private LB.

To understand the limitations of our models, we performed a visual inspection of the predictions. For the train set, we reviewed cases with the lowest validation scores.

Most of the observed mistakes were due to the inconsistent labeling, where the most common issue was holes in the wheels. In some cars, they were masked and in some they were not.

We don't have a validation score for the test set, but we found problematic images by counting the number of pixels where the network prediction confidence was low. To account for the different size of the cars in the images, we divided this number by the area of the background. Our ‘unconfidence’ metric was calculated as a number of pixels with scores in [0.3, 0.8] interval, divided by a number of pixels with scores in the interval  [0,  0.3) + (0.8, 0.9]. Of course, other approaches based on Information theory may be more robust, but this heuristic worked well enough.

We then ranked the images by ‘unconfidence’ score and visually inspected the top predictions. We found out that most of the errors were due to incorrect human labeling of category “white van”. Networks consistently were giving low confidence predictions on such images. We believe that it was due to the low presence of white vans in the training set and to the low contrast between the van and the white background. The image below shows gray areas in the mask where the prediction confidence was low.

We weren't the only ones who encountered this issue. It was discussed at the forum and other participants implemented post-processing heuristics to address this and similar cases.

There were also a few training masks with large errors, like the one shown below. Heng CherKeng posted fixed versions of the masks at the forum, but their number was relatively small and we didn’t use them during training.

Vladimir’s Approach

My first attempt was to use UNet with the same architecture as Sergey Mushinskiy. I used this before in the DSTL Satellite Imagery Feature Detection last spring, but I was unable to get above 0.997 (~50th place in the Public LB).

In the DSTL challenge, UNet with pre-trained encoder worked exactly the same as if it was initialized randomly. I was also able to show good result without pre-trained initialization in the other challenges, and because of that I got the impression that for UNet, pre-trained initialization is unnecessary and provides no advantage.

Now I believe that initialization of UNet type architectures with pre-trained weights does improves convergence and performance of binary segmentation on 8-bit RGB input images. When I tried UNet with encoder based on VGG-11 I easily got 0.972 (top 10 at Public Leaderboard).

For image augmentation, I used horizontal flips, color augmentations and transforming a car (but not background) to grayscale.

Top left - original, top right - car in grayscale, bottom row - augmentations in the HSV space.

Original Images had resolution (1918, 1280) and were padded to (1920, 1280), so that each side would be divisible by 32 (network requirement), then used as an input.

With this architecture and image size, I could fit only one image per GPU, so I did not use deeper encoders like VGG 16 / 19. Also my batch size was limited to only 4 images.

One possible solution would be to train on crops and predict on full images. However, I got an impression that segmentation works better when the object is smaller than the input image. In this dataset some cars occupied the whole width of the image, so I decided against cropping the images.

Another approach, used by other participants, was to downscale input images, but this could lead to some losses in accuracy. Since the scores were so close to each other, I did not want to lose a single pixel on this transformations (recall 0.000001 margin between the first and the second place at the Private Leaderboard)

To decrease the variance of the predictions I performed bagging by training separate networks on five folds and averaging their five predictions.

In my model I used the following loss function:

It's widely used in the binary image segmentations, because it simplifies thresholding, pushing predictions to the ends of the [0, 1] interval.

I used Adam Optimizer. For the first 30 epochs I decreased learning rate by a factor of two, when validation loss did not improve for two epochs. Then for another 20 epochs I used cyclic learning rate, oscillating between 1e-4 and 1e-6 on schedule: 1e-6, 1e-5, 1e-4, 1e-5, 1e-6, with  2 epochs in each cycle.

Few days before the end of the competition I gave a try to a pseudo-labeling and it showed consistent boost to the score, but I did not have enough time to fully leverage the potential of this technique in this challenge.

Predictions for each fold without post processing:

Alexander's approach

Like everyone else, I started with the well-known UNet architecture and soon realized that on my hardware I need to either resize input images or wait forever till it learns anything good on image crops. My next attempt was to generate a rough mask and create crops only along the border, however learning was still too slow. Then I started to look for new architectures and found a machine learning training video showing how to use LinkNet for image segmentation. I found the source paper and tried it out.

LinkNet is a classical encoder-decoder segmentation architecture with following properties:

  1. As an encoder, it uses different layers of lightweight networks such as Resnet 34 or Resnet 18.
  2. Decoder consists of 3 blocks: convolution 1x1 with n // 4 filters, transposed convolution 3x3 with stride 2 and n // 4 filters, and finally another convolution 1x1 to match the number of filters with an input size.
  3. Encoder and decoder layers with matching feature map sizes are connected through a plus operation. I also tried to concatenate them in filters dimension and use conv1x1 to decrease the number of filters in the next layers - it works a bit better.

The main drawback of this architecture is related to the first powerful feature that start from 4x smaller image size, so it might be not as precise as we could expect.

I picked Resnet 34 for an encoder. I also tried Resnet 18, which was not powerful enough, and Resnet 50, which had a lot of parameters and was harder to train. The encoder was pre-trained on Imagenet data set. One epoch took only 9 minutes to train and a decent solution was produced after only 2-3 epochs! You definitely should give LinkNet a try - it's blazingly fast and memory efficient. I trained it on full 1920*1280 images with 1 picture / GPU (7.5gb) for a batch.

I applied soft augmentations: horizontal flips, 100 pix shifts, 10% scalings, 5° rotations and HSV augmentations. Also, I used Adam (and RMSProp) optimizer with learning rate 1e-4 for the first 12 epochs and 1e-5 for 6 more epochs. Loss function: 1 + BCE - Dice. Test time augmentation: horizontal flips.

I also performed bagging to decrease the variance of predictions. Since my training time was so fast, I could train multiple networks and average their predictions. Finally, I had 6 different networks, with and without tricks, with 5 folds in each network, i.e. I averaged 30 models in total. It’s not a big absolute improvement, every network made some contribution, and the score difference with the second place on the private leaderboard was tiny.

Less common tricks:

  1. Replace plus sign in LinkNet skip connections with concat and conv1x1.
  2. Hard negative mining: repeat the worst batch out of 10 batches.
  3. Contrast-limited adaptive histogram equalization (CLAHE) pre-processing: used to add contrast to the black bottom.
  4. Cyclic learning rate at the end. Exact learning rate schedule was 3 cycles of: (2 epoch 1e-4, 2 epoch 1e-5, 1 epoch 1e-6). Normally, I should pick one checkpoint per cycle, but because of high inference time I just picked the best checkpoint out of all cycles.

Artsiom's approach

I trained two networks that were part of our final submission. Unlike my teammates who trained their models on the full resolution images, I used resized 1024x1024 input images and upscaled the predicted masks back to the original resolution at the inference step.

First network: UNet from scratch

I tailored a custom UNet with 6 Up/Down convolutional blocks. Each Down block consisted of 2 convolutional layers followed by 2x2 max-pooling layer. Each Up block had a bilinear upscaling layer followed by 3 convolutional layers.

Network weights were initialized randomly.

I used  f(x) = BCE + 1 - DICE as a loss function, where BCE  is per-pixel binary cross entropy loss and DICE is a dice score.

When calculating BCE loss, each pixel of the mask was weighted according to the distance from the boundary of the car. This trick was proposed by Heng CherKeng. Pixels on the boundary had 3 times larger weight than deep inside the area of the car.

The data was divided into 7 folds without stratification. The network was trained from scratch for 250 epochs using SGD with momentum, multiplying learning rate by 0.5 every 100 epochs.

Second network: UNet-VGG-11

As a second network I took UNet with VGG-11 as an encoder, similar to the one used by Vladimir, but with a wider decoder.

VGG-11 (‘VGG-A’) is an 11-layer convolutional network introduced by Simonyan & Zisserman. The beauty of this network is that its encoder (VGG-11) was pre-trained on Imagenet dataset which is a really good initialization of the weights.

For cross-validations I used 7 folds, stratified by the total area of the masks for each car in all 16 orientations.

The network was trained for 60 epochs with weighted loss, same as was used in the first network, with cyclic learning rate. One learning loop is 20 epochs: 10 epochs with base_lr, 5 epochs with base_lr * 0.1, and 5 epochs with base_lr * 0.01.

The effective batch size was 4. When it didn’t fit into the GPU memory, I accumulated the gradients for several iterations. 

I used two types of augmentations:

  • Heavy - random translation, scaling, rotation, brightness change, contrast change, saturation change, conversion to grayscale.
  • Light - random translation, scaling and rotation.

The first model was trained with heavy augmentations. The second one was trained for 15 epochs with heavy augmentations and for 45 epochs with light augmentations.

Results

In total I have trained 14 models (2 architectures, 7 folds each). The table below shows the dice score on cross-validation and on the public LB.

Ensembling of the models from different folds (line ‘ensemble’ in the table) was performed by averaging 7 predictions from 7 folds on the test images.

As you can see, ensembles of both networks have roughly the same performance - 0.9972. But because of the different architectures and weights’ initialization, a combination of these two models brings a significant contribution to the performance of our team’s final ensemble.

Merging and Post Processing

We used a simple pixel-level average of models as a merging strategy. First, we averaged 6*5=30 Alexander’s models, and then averaged all the other models with it.

We also wanted to find outliers and the hard cases. For this, we took an averaged prediction, found pixels in probability range 0.3-0.8, and mark them as unreliable. Then we sorted all results unreliable pixels area, and additionally processed the worst cases. For these cases, we selected best-performing models and adjusted probability boundary. We also performed convex hull on areas with low reliability. This approach gave good-looking masks for cases where our networks failed.

Extra materials


Mercedes-Benz Greener Masking Challenge Masking Challenge–1st Place Winner's Interview

$
0
0

To ensure the safety and reliability of each and every unique car configuration before they hit the road, Daimler’s engineers have developed a robust testing system. But, optimizing the speed of their testing system for so many possible feature combinations is complex and time-consuming without a powerful algorithmic approach.

In this competition launched earlier this year, Daimler challenged Kagglers to tackle the curse of dimensionality and reduce the time that cars spend on the test bench. Competitors worked with a dataset representing different permutations of Mercedes-Benz car features to predict the time it takes to pass testing. Winning algorithms would contribute to speedier testing, resulting in lower carbon dioxide emissions without reducing Daimler’s standards.

The dataset contained an anonymized set of variables (8 categorical and 368 binary features), labeled X0, X1,X2…, each representing a custom feature in a Mercedes car. For example, a variable could be 4WD, added air suspension, or a head-up display.

The dependent variable was the time (in seconds) that the car took to pass testing for each variable. Train and test sets had 4209 rows each.

In this interview, first place winner, gmobaz, shares how he used an approach that proposed important interactions.

Basics

What was your backgrounds prior to entering this challenge?

I studied at UNAM in Mexico to become an Actuary and hold a Master in Statistics and Operations Research from IIMAS-UNAM. I've been involved in statistics for several years; worked some years at IIMAS as a researcher in the Probability and Statistics Department and have worked since then for a long time in applied statistics, mainly as a statistical consultant in health sciences, market research, business processes and many other disciplines.

How did you get started competing on Kaggle?

After some years working in the oil industry, in a non-related field, I decided to go back to statistics but was aware that I had to refresh my mathematical, computational and statistical skills, reinvent myself and learn at least R well enough to get back. That’s when I found Kaggle’s website. It had the best ingredients for learning by doing: having fun, real problems, real data and a way to compare my progress. Since then, I've participated regularly on Kaggle, mainly to keep in shape and to be aware of recent advances.

What made you decide to enter this competition?

At a first glance, this competition seemed to have elements in common with the Bosch competition. Working with many binary and categorical features is a very interesting problem and good solutions are difficult to find. Before entering the competition, I had time to follow the discussions and read some splendid EDA’s, particularly by SRK, Head or Tails and Marcel Spitzer that helped a lot in gaining insight to understand the manufacturing and modelling problems.

Let's Get Technical

What preprocessing and feature engineering did you do?

Before doing any modelling or feature engineering, first thing I usually try to do is to get what I call a basic kit against ignorance: main concepts, bibliography and grab whatever helps to understand the problem from the sector/industry perspective. In this way there will be a guide to propose new features and a clearer understanding of datasets and measurement issues like missing values.

With an anonymized set of features, what kind of new features would be interesting to explore? I imagined passing through the test bench as part of a manufacturing processes where some activities depend on previous ones. I set up some working hypotheses:

  • A few 2- or 3-way interactions and a small set of variables could be relevant in the sense that test time changes could be attributable to a small set of variables and/or parts of few subprocesses.
  • Lack of synchronization between manufacturing subprocesses could lead to time delays.

The following are the features considered in the modelling process:

  1. I found that parameters for XGBoost in kernels, for example, by Chippy or anokas and findings in EDA’s were consistent with the working hypotheses. So, how to explore interactions? Just two-way interactions of binary variables would lead to explore 67528 new variables, which sounded like a lot of time and effort, so the task was to identify quickly some interesting interactions. Search for them was done looking at patterns in preliminary XGBoost runs. Some pairs of individual variables appeared always “near” in the variable importance reports. With just three pairs of individual features, two-way interactions were included and, additionally, a three-way interaction.
  2. Thinking on the subprocesses, I imagined that the categorical features, were some sort of summary of parts of the manufacturing testing process. The holes in the sequencing of the binary feature names took me to define nine groups of binary variables, consistent with the eight categorical ones. Within these nine groups, cumulative sums of binary variables were thought as aids to catch some joint information of the process. Despite the burden of introducing quite a few artificial and unwanted dependencies, models based on decision trees can handle this situation.
  3. After some playing with the data, I decided to recode eleven of the levels of first categorical feature (trigger of the process?)
  4. One-hot encoding of categorical features was applied, that is, the original and the ones created for interaction variables. One-hot encoding variables were kept if sum of ones exceeded 50. Since this value looks reasonable, but arbitrary, it is subject to tests.
  5. To include or not ID was a question I tried to answer in preliminary runs. Discussions in the forum suggested that including ID was totally consistent with my thoughts on the Mercedes process. I detected very modest improvements in preliminary runs; it was included.
  6. It is known that decision tree algorithms can handle categorical features transformed to numerical, something that makes no sense in other models. These features were also included, which completed the initial set of features considered.

So, starting with 377 features (8 categorical, 368 binary and ID), I ended with 900 features; awful! And a relatively small dataset…  

Can you introduce your solution briefly?

Two models were trained with XGBoost, named hereafter Model A and Model B. Both were built in a sequence of feature selection steps, like backward elimination. Model B uses a stacked predictor formed in a step of Model A. Any decision point in this sequence is preceded by a 30-fold cross validation (CV) to find the best rounds. The steps are very simple:

  1. Preliminary model with all features included, Model A, 900 features and Model B, 900+1, the stacked predictor.
  2. Feature selection. Keep the variables used by XGBoost as seen on variable importance reports (229 in Model A, 208 in Model B).
  3. Feature selection. Include features with gains above a cut value in the models; 0.1%, in percentage, was the cut value used, 53 in Model A, 47 in Model B.

Both models use XGBoost and a 30-fold CV through all the model building process. The rationale for a 30-fold validation was to use it in a 30-fold stacking as input for Model B.  The stacked predictor might damp the influence of important variables and highlight new candidates to look for some more interesting interactions.

The most important features

As can be seen from the graph below, interactions played the most important role in the models proposed (anonymized) features.

  • By far, pair (X314, X315), jointly and pair levels
  • 3-way interaction (X118, X314, X315)
  • X314
  • (X118, X314, X315), levels (1,1,0)
  • Individual features:X279, X232, X261, X29
  • Two levels of X0 recoded and X0 recoded
  • Sum of X122 to X128
  • X127

Notably in the discussions, besides one kernel by Head and Tails dealing specifically with interactions, I found no other reference to any 2 or n-way interactions, different from the ones I used.

How long did it take to train your model?

During the contest, work was done in R Version 3.4.0, Windows version. After the contest, Version 3.4.1 was used.

For common data in both models, initial data management took less than 4 seconds. For steps 1-3 in training method, Model A needed approximately 3.4 minutes, Model B took around 4.3 minutes on a desktop I7-3770 @3.40 GHz, 8 cores, 16 MB RAM. Starting from loading packages to submissions delivery for both models, the code took circa 8 minutes.

Loading packages and preparing Model A took 4.5 seconds. To generate predictions for 4209 observations from test set took around 2.3 seconds.

The winning solution was a simple average of both models. Individually each one outperformed the results of the 2nd place winner. The good news is that Model B does not really add value; stacking is therefore not necessary and a simpler model, model A, is advisable.

What was the most important trick you used?

I think the competition was on trapping individual variables and propose important interactions. The way I selected interactions was a shortcut for finding some of them. Trapping individual variables was mainly the goal of the stacking phase, without apparent success. The shortcut for identifying interactions looks attractive and I have used it before with good results.

I was afraid on using cumulative sums of binary variables due the dependencies between them. Given the results, I would try shorter sequences around some promising variables.

Words of wisdom

What have you taken away from this competition?

Any competition allows you to learn new things. After the competition, making tests, cleaning code, documenting and presenting results was an enriching experience.

Do you have any advice for those just getting started in data science?

1. Identify your strengths and weaknesses: mathematics, your own profession, statistics, computer science. With the need to know from all, balance is needed and black holes in knowledge will appear almost surely. I found a quote in Slideshare from a data scientist, Anastasiia Kornilova, who summarizes my view very well (graph adapted with my personal bias):

It’s the mixture that matters”.


There is always a chance to fill some black holes and don’t worry: it will never end.

2. Learn from others with no distinction of titles, fame, etc. The real richness of Kaggle is the diversity of approaches, cultures, experience, problems, professions, …

3. If you compete in Kaggle, compete against yourself setting personal and realistic goals and, above all, enjoy!

4. PS. Don’t forget to cross-validate


Our Final Kaggle Dataset Publishing Awards Winners' Interviews (November 2017 and December 2017)

$
0
0

As we move into 2018, the monthly Datasets Publishing Awards has concluded. We're pleased to have recognized many publishers of high-quality, original, and impactful datasets. It was only a little over a year ago that we opened up our public Datasets platform to data enthusiasts all over the world to share their work. We've now reached almost 10,000 public datasets, making choosing winners each month a difficult task! These interviews feature the stories and backgrounds of the November and December winners of the prize. This month, we're pleased to highlight:

While the Dataset Publishing Awards are over, you can still win prizes for code contributions to Kaggle Datasets. We're awarding $500 in weekly prizes to authors of high quality kernels on datasets. Click here to learn more »

November Winners:

First Place, EEG data from Basic Sensory Task in Schizophrenia by Brian Roach

Can you tell us a little about your background?

I am currently working as a programmer analyst in a brain imaging and electroencephalography (EEG) lab focused on schizophrenia.  It is an academic research lab run by three professors in the department of psychiatry at UCSF.  Prior to moving out to San Francisco, I worked at Yale University.  I have a masters in statistics from Texas A&M University.  Before that, I studied cognitive science at Vassar College, where I had my first exposures to EEG and computer programming.

What motivated you to share this dataset with the community on Kaggle?

I was motivated to share this dataset for several reasons. The lab recently received some funding to work on single trial EEG classification in patients with schizophrenia and comparison control subjects. In particular, we run a set of experiments like the one used in the dataset I uploaded where participants control the stimulus presentation (e.g., press a button to generate a sound) in one condition or passively observe the stimuli (e.g., listen to a series of sounds based on their previously generated sequence) in another condition. Humans and many other animals are able to suppress the response to self generated stimuli.  We have observed that people with schizophrenia, relative to comparison control subjects, do not show as strong a pattern of suppression in the averaged EEG brain response, called the Event-Related Potential (ERP).  While we see this in the averaged response, classification of single trials might allow us to see what features in the EEG best differentiate between these conditions.  I thought sharing this dataset on Kaggle might be a way to get feedback from the community on different approaches to this binary classification problem.

The other big reason was that after attending neurohackweek at the University of Washington this Fall, I came back to the lab with concrete examples of combating the neuroscience reproducibility crisis in mind. Sharing both data and code to increase transparency should improve the research process and aid peer review. Publishing this dataset on Kaggle was a straightforward way to make both data and code available on one, easily accessible platform.

What have you learned from the data?

One of the first things that I tried to verify that everything worked with my python import was to apply the common spatial patterns (CSP) function to some of the data.  It is not clear the spatial topography is as consistent across subjects as it was in the EEG grasping data.  I was also able to reproduce some but not all of the ERP effects previously published in a paper using R in this notebook.  

What questions would you love to see answered or explored in this dataset?

As I mentioned above, single trial classification, particularly binary classification of the button press + tone vs the passive tone playback might be used to address questions like: (1) Can we predict trial type with equivalent accuracy in both patients and controls? (2) Do the features in the EEG the best predict trial type vary between patients and controls? (3) Within the patient group, are there different sub-groups with similar feature patterns that differentiate the two trial conditions?  For example, maybe some patients have more motor signal abnormalities, and others have more abnormal auditory sensory responses.  Identifying these types of differences might allow future research studies to focus on patient-specific interventions (e.g., targeting motor vs auditory processing).

Second Place, Classification of Handwritten Letters, Images of Russian Letters by Olga Belitskaya

Can you tell us a little about your background?

After being a housewife for a long time, I'm returning again to the workforce. My higher educations, received 15-22 years ago, were in the field of economics and teaching of mathematics, physics and computer science. Over the past year, I have completed two interesting courses in modern programming (Data Analyst and Machine Learning Engineer). Now I'm going to find a job and apply my knowledge.

What motivated you to share this dataset with the community on Kaggle?

Two very well-known datasets (handwritten figures and letters of the English alphabet) are widely used to teach programming skills. It was interesting for me to create a similar set of Russian letters and assess how much more difficult it is for processing and classifying.

What have you learned from the data?

For me, it was surprising how colors and backgrounds influence the recognition of the main object by algorithms. It seems to me it will be not so easy to improve the accuracy of classifying this data. I have already learned a lot about this and will continue to discover problems.

What questions would you love to see answered or explored in this dataset?

Using this database, we can explore a very wide range of questions in image recognition.

The advantages of this set are absolute realism (the letters are simply written by hand and photographed), a large range of colors, several different backgrounds.

So, this data allows conducting research in many areas:

  • find a way to improve the classification accuracy;
  • determine how the background and color decrease recognition;
  • discover how well images are generated by algorithms based on real ones.

This database (and questions about it)  can be expanded in several directions:

  • add images with more backgrounds,
  • add a sufficient number of capital letters and assess the deterioration of forecasting,
  • find another person to write the same letters and try to classify their personal handwriting.

Third Place, Darknet Market Cocaine Listings by David Skip Everling

Can you tell us a little about your background?

​My name is David Everling (aka Skip)! I'm a jack-of-all-trades data scientist who loves big ideas and creative engineering.

I studied Information Systems at Carnegie Mellon University in Pittsburgh, PA. I now live in the SF Bay Area (about 10 years), and I have been fortunate to work with prestigious tech companies like Google, Palantir, and Segment. I also spent two years as a neuroimaging researcher at Stanford University. ​I love to collaborate with smart, data-driven teams.

Currently I'm looking for opportunities to join a team of data scientists in San Francisco on a full-time basis. More about me on LinkedIn.

What motivated you to share this dataset with the community on Kaggle?

Megan from Kaggle saw a tweet from David Robinson about my project, and she suggested that I upload the dataset to Kaggle to share my work. I thought it was a good idea and agreed! I had no idea that it would qualify for a prize.

What have you learned from the data?

This was a fascinating dataset! I chose to scrape cocaine listings because that drug is easily quantifiable and can be compared across offerings.

The data makes plain how drugs are both wholesale and retail goods in digital marketplaces. They have economic patterns and competition just like traditional Internet retailers on Amazon. You can shop for deals on cocaine just like you shop for deals on a new mattress.

Cocaine sales follow particular geographic patterns that depend on factors like shipping connections and border control at the countries of origin and destination. Cocaine costs the most to order to Australia by a wide margin. The region selling the most cocaine internationally on this market seems to be northern central Europe centered around the Netherlands.

Because real-world identity is anonymized, trust is always a concern between parties on the dark web. As such, vendor ratings (not just product ratings) are among the most important features of a listing. If you are not a trusted vendor with corroborated transactions, few will risk buying from you even if you undercut prices. Therefore vendors have to curate their dark web identities for trust and reliability. New vendors might have to list "freebies" to attract buyers.

As a market average not controlling for local factors and sales, 100% pure cocaine costs a bit under $100 USD per gram.

You can read more about the data insights in my post on Medium.

What questions would you love to see answered or explored in this dataset?

It would be very interesting to see a more thorough exploration of vendor pricing schemes. For example: Do cocaine vendors use the same kind of bulk discounts and promotional sales as "clear web" retailers? How do new sellers attract buyers?

I collected vendor ratings and number of successful transactions, but haven't had time to explore those. How does a vendor's rating affect their prices? Does whether a vendor offers escrow affect their listings?

What other patterns are present in the product's text string? In the dataset I have already extracted price and quality, but there are other potentially meaningful signifiers present. For example, the words "uncut", "sample", or "Colombian" may each have an impact on the listing. These could become new features.

Which countries are the biggest cocaine exporters in this market? How are real-world cocaine markets *not* reflected in this dataset?

Can we visualize the market from this dataset?

Feel free to adapt any or all of the code I wrote to process the data. You can find it here on Github!

December Winners:

First Place, Breast Histopathology Images by Paul Mooney

Can you tell us a little about your background?

My graduate research demanded that I quantitatively analyze large datasets of digital images that were acquired using fluorescence microscopy.  In order to facilitate the statistical analysis of these large datasets, I frequently worked with scripting languages such as MATLAB and ImageJ Macro, and I took courses and pursued independent projects using both Python and Octave.  Currently, I am inspired by the use of Python for applications such as Predictive Analytics, Machine Learning, and Data Science, and I have found that the Kaggle platform provides an excellent arena for my continued education.

What motivated you to share this dataset with the community on Kaggle?

I am interested in biomedical data, and I like to use the Kaggle platform to experiment with open-access biomedical datasets. The NIH does fantastic work to support and maintain numerous open-access data repositories (https://www.nlm.nih.gov/NIHbmic/nih_data_sharing_repositories.html), and crowd-sourced data analysis platforms are a promising tool that can be used to extract new insights and make new discoveries from this important data.

What have you learned from the data?

Convolutional networks can be used to identify diseased tissue and score disease progression. Advancements in deep learning algorithms are a promising new hope in the fight against cancer -- and the Kaggle Kernel is a great platform to test out new deep learning approaches (https://www.kaggle.com/paultimothymooney/predict-idc-in-breast-cancer-part-two).

What questions would you love to see answered or explored in this dataset?

Breast cancer is the most common form of cancer in women, and invasive ductal carcinoma (IDC) is the most common form of breast cancer. Accurately identifying and categorizing breast cancer subtypes is an important clinical task, and automated methods can be used to save time and reduce error. In the future it will be interesting to see how deep learning approaches can be used to improve this diagnostic task as well as improve other diagnostic tests in other clinical settings. The Kaggle platform is a powerful tool for developing computational methods in modern medicine, and open-access datasets just add fuel to the flame of new discovery.

Second Place, Historical Hourly Weather Data, 2012 to 2017 by SelfishGene

Can you tell us a little about your background?

Originally, I'm an Electrical Engineer, graduated in 2011. After graduation I worked several years as a Computer Vision Algorithms Developer at Microsoft Research, and 3 years ago I decided to start a PhD in Computational Neuroscience, with the goal to draw inspiration from the brain in order to someday help build Artificial Intelligence. A friend told me about Kaggle around 4 years ago, and ever since I try to participate every once in a while whenever I have some free time. It's both a lot of fun, and also a great opportunity to hone your skills. I feel that a large amount of what I know is also due to the motivation surges that one gets when participating in kaggle competitions.

What motivated you to share this dataset with the community on Kaggle?

There were two main motivations.
First, I really am a big fan of what Kaggle is trying to do with open datasets and reproducible research. During my last couple of years in academia, I realize more and more how important and not trivial those two things are. It is too often the case that researchers around the world hold on to their data as if it's "their precious", and it is also too often the case when research is simply not reproducible. So I wanted to add my small contribution to this tremendous undertaking and this dataset is one of the ways I could do so.
Second, I'm currently in the process of trying to put together an introductory course on data analysis. Since the course I want to build is somewhat different compared to standard ML courses and in it I want to, among other things, introduce also standard signal processing concepts, such as filtering, Fourier transforms, auto-correlation, cross-correlation, etc. I needed a suitable dataset to demonstrate these concepts on. Another requirement I wanted is a dataset that we all have intimate familiarity with and intuitive understanding of. Weather data is an excellent candidate for demonstrating these signal processing concepts since it contains interesting periodic structure (it has both a yearly period, and a daily period) and it's definitely something we all have intimate familiarity with. Technically, In order to capture the daily period, I needed to find a high temporal resolution dataset, and I've stumbled upon this API at OpenWeatherMap which was perfect for my needs.

What have you learned from the data?

Haven't learned much yet since it's quite fresh, but I hope we will all learn many interesting things in the upcoming months when people post scripts that use this data 🙂

What questions would you love to see answered or explored in this dataset?

Weather is potentially correlated to a huge amount of everyday things, like demand for cabs, like whether people ride the bike or not, like the conditions in which wildfires spread, and even potentially which crimes are committed and when. Due to the breadth of kaggle datasets, all of those things actually have datasets on kaggle already (I link to some of them on the dataset page), and it's now easy to explore these potential correlations with kaggle kernels. and these are of course just a few examples that I could come up with, and one can come up with even more interesting things.

Third Place, Darknet Marketplace Data by Philip James

Can you tell us a little about your background?

Right now I’m a junior at Fordham University majoring in Computer Science and minoring in Mathematics. I’ve actually only been a CS major for about 6 months, but I’ve found it to be something that I naturally excel in, care deeply about, and love expanding my knowledge upon.

Most recently I’ve been doing some self-learning on machine learning and statistical analysis to satisfy my personal curiosities and goals, but I’ve also been doing some really cool research over at Fordham! At the moment I’m working on two separate projects concurrently, one dealing with computer vision, and the other with wireless sensor efficiency and placement. You can find more details here on my Linkedin!

What motivated you to share this dataset with the community on Kaggle?

It was just a “happy accident,” as Bob Ross would say. I was scouring the web to find some datasets and/or machine learning competitions when I happened to stumble upon Kaggle. After exploring the really fantastic datasets people had contributed, I realized I had just finished up a dataset of my own that could be really fun to mess around with, so I decided to share it!

What have you learned from the data?

Most prominently, I learned the extent of the trade of goods and services on the dark web. It’s astonishing to see the sheer volume and diversity of things being sold that aren’t available through legal channels. Perhaps one the the most interesting things I found was everyday items, such as magazine subscriptions, being sold on the same marketplace that contained highly illegal goods.

Brooks made some really fantastic visuals related to the dataset that I definitely recommend checking out here. They really help visualize the data wonderfully.

What questions would you love to see answered or explored in this dataset?

Honestly, there’s so many I don’t know where to start. I think it would be really neat to see competition between vendors by comparing items in certain price categories, or perhaps even just trying to find if there are any correlations between price and vendor rating. Maybe certain regions sell more of a particular kind of item, or simply see if some seller dominates some niche. The possibilities are quite extensive with a little bit of imagination!

A Brief Summary of the Kaggle Text Normalization Challenge

$
0
0

This post is written by Richard Sproat & Kyle Gorman from Google's Speech & Language Algorithms Team. They hosted the recent, Text Normalization Challenges. Bios below.

Now that the Kaggle Text Normalization Challenges for English and Russian are over, we would once again like to thank the hundreds of teams who participated and submitted results, and congratulate the three teams that won in each challenge.

The purpose of this note is to summarize what we felt we learned from this competition and a few take-away thoughts. We also reveal how our own baseline system (a descendent of the system reported in Sproat & Jaitly 2016) performed on the two tasks.

First some general observations. If there’s one difference that characterizes the English and Russian competitions, it is that the top systems in English involved quite a bit of manual grammar engineering. This took the form of special sets of rules to handle different semiotic classes such as measures, or dates, though, for instance, supervised classifiers were used to identify the appropriate semiotic class for individual tokens. There was quite a bit less of this in Russian and the top solutions there were much more driven by machine-learning solutions, some exclusively so. We interpret this to mean that, given enough time, it is not too hard to develop a hand-built solution for English, but Russian is sufficiently more linguistically complicated that it would be a great deal more work to build a system by hand. The first author was one of the developers of the original Kestrel system for Russian, which was used to generate the data used in this competition, and he can certainly attest to it being a lot harder to get right than English.

Second, we’re sure everyone is wondering: how well does our own system perform? Since participants used different amounts of data in addition to the official Kaggle training data—most used some or all of the data on the GitHub repository, which is a superset of the Kaggle training data—it is hard to give a completely “fair” comparison, so we decided to restrict ourselves to a model that was trained only on the official Kaggle data.

In the tables and charts below, the top performing Kaggle systems are labeled en_1, en_2, en_3 and ru_1, ru_2, ru_3 for the first, second and third place in each category. Google is of course our system. Google+fst (English only) is our system with a machine-learned finite-state filter that constrains the output of the neural model and prevents it from producing “silly errors” for some semiotic classes; see, again, the Sproat & Jaitly 2016 paper for a description of this approach.

As we can see, the top performing English systems did quite a bit better overall than our machine-learned system. Our RNN performed particularly poorly compared to the other systems on MEASURE expressions (things like 3 kg), though the FST filter cut our error rate on that class in half.

For Russian, on the other hand, we would have come in second place, if we had been allowed to compete. From our point of view, the most interesting result in the Russian competition was the second-place system ru_2. While the overall scores were not quite as good as ru_1 or our system, the performance on several of the “interesting” classes was quite a bit better. ru_2 got the lowest error rate on MEASURE, DECIMAL and MONEY, for example. This system used Facebook AI Research’s fairseq system, a convolutional model (CNN) that is becoming increasingly popular in Neural Machine Translation. Is such a system better able to capture some of the class-specific details of the more interesting cases? Since ru_2 also used eight files from the GitHub data, it is not clear whether this is due to a difference in the neural model (CNN versus RNN with attention), the fact that more data was used, or some combination of the two. Some experiments we’ve done suggest that adding in more data gets us more in the ballpark of ru_2’s scores on the interesting classes, so it may be a data issue after all, but at the time of writing we do not have a definite answer on that.

Author Bios:

Richard Sproat is a Research Scientist in the speech & language algorithms team at Google in New York. Prior to joining Google he worked at AT&T Bell Laboratories, the University of Illinois and the Oregon Health & Science University in Portland.

Kyle Gorman works on the speech & language algorithms team at Google in New York. Before joining Google in 2015, he worked as a postdoctoral research assistant, and assistant professor, at the Center for Spoken Language Understanding at the Oregon Health & Science University in Portland.

From Kaggle competition to start-up and tracking 2 million km² of forest

$
0
0

This is a guest post written by Kaggle Competition Master and  part of a team that achieved 5th position in the 'Planet: Understanding the Amazon from Space' competition, Indra den Bakker. In this post, he shares the journey from Kaggle competition winner to start-up founder focused on tracking deforestation and other forest management insights.

Back in the days, during my studies I was introduced to Kaggle. For the course ‘Data Mining Techniques’ at VU University Amsterdam we had to compete in the competition Personalize Expedia Hotel Searches — ICDM 2013. Me and my fellow team members did okay but we were far from the top scoring teams. However, I immediately wanted to learn more about the field of machine learning and it’s applications.

In the years to come, I competed in several competitions. I never managed to dedicate as much time as I wanted but every single competition was a great learning experience. In 2017, one of the goals that I had set for myself was to pick a Kaggle competition and fully focus on it to get my first golden medal. The competition I picked was Planet: Understanding the Amazon from Space. I already had some experience with satellite imagery and the use case sounded interesting. This turned out to be a great pick with many consequences in the months afterwards.

Analysing the Amazon with Planet
I started working on the competition roughly one month before the deadline and I immediately took a deep dive with experimenting with pre-trained deep learning models. This soon turned out to be the way to go and I managed to get some decent scores. This, of course, tasted like more. I kept track of all the messages in the discussion board and I learned tons from my fellow Kagglers.

Kaggle competition Planet: Understanding the Amazon from Space, source: https://www.kaggle.com/c/planet-understanding-the-amazon-from-space

For those not familiar with the Planet competition, the goal of the competition was to track the human footprint in the Amazon rainforest. The satellite imagery was provided by Planet and had 3m resolution — this means that every pixel resembles 3 meters. This allows to detect small changes like selective logging. The competition is set-up as a multi-label classification problem and the metric used was the F2-score. The labels included selective logging, agriculture, primary rainforest, clouds, roads, and more.

One thing that is great about Kaggle is that everyone — also the high ranking competitors — is always open to share their insights and ideas. A great example is Heng CherKeng, who was one of the biggest drivers of this competition and shared most of his code during the competition.

Golden medal and Kaggle Master tier
With one week to go I was moving around in top 15 when I was invited to join a team. I knew that joining a team and ensembling the models could give a boost so I decided to accept. After an intense couple of weeks with sleepless nights the reward was an amazing 5th position and a golden medal resulting in a Kaggle Master tier. I know that I couldn’t have achieved this without my teammates Eureka and weiwei. Even more, the resulting F2 score > 93% can have a great impact on how to process large amounts of satellite data to classify small scale activities in the Amazon rainforest.

Moving forward
Already during the competition I started to think about what else could be done with this information. Of course, Planet had to set-up a fair playing field for this competition, but I was quite certain that with additional information and techniques we could push the boundaries of the results even further.

I connected with Anniek — now co-founder of 20tree.ai — and we started discussing what else we could do with these types of satellite imagery. In the original competition we had to classify fixed chips of images with 4-bands. This is a static moment in time, but the beauty of satellite imagery is that you can add the time dimension. Especially with the frequent revisits of Planet’s satellite constellation you can inspect pieces of land over time. A logging road starts as a small dot but increases in length over time. Moreover, ideally you don’t only want to classify images itself, but you want to locate where deforestation occurs on pixel level. And maybe we could even find the underlaying patterns and predict areas to monitor more closely.

Sometimes people argue that the top algorithms in Kaggle competitions are too complex to use in production and often a simpeler model would work just as good in real life. In our case, the large ensemble of models used in the Kaggle competition is just a small part of an even larger ensemble of models and additional techniques used to retrieve insights.

2nd prize in the Airbus GEO Challenge 2017, source: https://www.agorize.com/en/challenges/airbus-challenge/pages/final

Airbus GEO Challenge
We decided to do some research in the field and to learn more about satellite imagery and forestry. The areas to protect from deforestation are huge, so the combination of satellite imagery and deep learning to detect early patterns seemed like a sweet spot to us. Moreover, the availability of high-resolution satellite imagery (up to 30cm), the availability of radar data, and the increasing revisits by different providers could provide timely insights that stakeholders can use to act upon.

There was indeed a growing number of companies working to retrieve valuable information from satellite imagery, but most of them seemed to focus on other verticals. With our ideas in mind we decided to compete in the Airbus GEO Challenge. To our surprise, after a couple of rounds, we were invited for the finals in Toulouse, France and we won the 2nd place including a voucher to buy satellite imagery.

DigitalGlobe Sustainability Challenge
In the months after the challenge, we connected with different stakeholders and we received a lot of positive feedback. We decided to register our new start-up 20tree.ai. At 20tree.ai we don’t only focus on deforestation, but we also provide our customers with forest insights to make forest management more sustainable and efficient. We kicked of with a couple of Proof of Concepts and signed our first customers in the months after.

In the beginning of 2018 we submitted our project proposal for the DigitalGlobe Sustainability Challenge and we were selected as one of the 5 winners. This gives us access to DigitalGlobe’s high-resolution imagery that we use to develop deep learning models to detect deforestation, for instance illegal logging and expansion of agriculture. For this project, we are collaborating with partners like WWF — one of the biggest drivers behind protecting the Cerrado — to provide actionable forest insights, trends and predictions on one of the most threatened regions of Brazil: the Cerrado. The total area we are tracking is more than 2,000,000 km². With this project we hope to contribute to the Cerrado Manifesto, signed by 61 of the world’s largest food companies.

Becoming the standard in planet intelligence
We strongly believe this is just the start of an amazing journey that will follow. There is much more in the field of planet intelligence that we want to explore, from soil and water intelligence to environmental impact. This all contributes to a new standard in data-driven planet intelligence.

On the technical side, we are also experimenting with novel ideas. From leveraging GANs and custom Super-Resolution models to using reinforcement learning to train an agent to determine which areas to monitor, why, and with which resolution.

We are often asked why we decided to move into this field and especially the application of forestry. We always proudly react that it all started with an inspiring Kaggle competition.

Kaggle profile: https://www.kaggle.com/indradenbakker

Profiling Top Kagglers: Bestfitting, Currently #1 in the World

$
0
0

We have a new #1 on our leaderboard – a competitor who surprisingly joined the platform just two years ago. Shubin Dai, better known as Bestfitting on Kaggle or Bingo by his friends, is a data scientist and engineering manager living in Changsha, China. He currently leads a company he founded that provides software solutions to banks. Outside of work, and off Kaggle, Dai’s an avid mountain biker and enjoys spending time in nature. Here’s Bestfitting:

Can you tell us a little bit about yourself and your background?

I majored in computer science and have more than 10 years of experience in software development. For work, I currently lead a team that provides data processing and analyzing solution for banks.

Since college, I’ve been interested in using math to building programs that solve problems. I continually read all kinds of computer science books and papers, and am very lucky to have followed the progress made on machine learning and deep learning within the past decade.

How did you start with Kaggle competitions?

As mentioned before, I’ve been reading a lot of books and papers about machine learning and deep learning, but found it always hard to apply the algorithms I learned on small datasets that are readily available. So I found Kaggle a great platform with all sorts of interesting datasets, kernels, and great discussions. I couldn’t wait to try something, and first entered the “Predicting Red Hat Business Value” competition.

What is your first plan of action when working on a new competition?

Within the first week of a competition launch, I create a solution document which I follow and update as the competition continues on. To do so, I must first try to get an understanding of the data and the challenge at hand, then research similar Kaggle competitions and all related papers.

What does your iteration cycle look like?

  1. Read the overview and data description of the competition carefully
  2. Find similar Kaggle competitions. As a relatively new comer, I have collected and done a basic analysis of all Kaggle competitions.
  3. Read solutions of similar competitions.
  4. Read papers to make sure I don’t miss any progress in the field.
  5. Analyze the data and build a stable CV.
  6. Data pre-processing, feature engineering, model training.
  7. Result analysis such as prediction distribution, error analysis, hard examples.
  8. Elaborate models or design a new model based on the analysis.
  9. Based on data analysis and result analysis, design models to add diversities or solve hard samples.
  10. Ensemble.
  11. Return to a former step if necessary.

What are your favorite machine learning algorithms?

I choose algorithms case by case, but I prefer to use simple algorithms such as ridge regression when ensemble, and I always like starting from resnet-50 or designing similar structure in deep learning competitions.

What are your favorite machine learning libraries?

I like pytorch in computer vision competitions very much. I use tensorflow or keras in NLP or time-series competitions. I use seaborn and products in the scipy family when doing analysis. And, scikit-learn and XGB are always good tools.

What is your approach to hyper-tuning parameters?

I try to tune parameters based on my understanding of the data and the theory behind an algorithm, I won’t feel safe if I can’t explain why the result is better or worse.

In a deep learning competition, I often search related papers and try to find what the authors did in a similar situation.

And, I will compare the result before and after making parameter changes, such as the prediction distribution, the examples affected, etc.

What is your approach to solid cross-validation/final submission selection and LB fit?

A good CV is half of success. I won’t go to the next step if I can’t find a good way to evaluate my model.

To build a stable CV, you must have a good understanding of the data and the challenges faced. I’ll also check and make sure the validation set has similar distribution to the training set and test set and I’ll try to make sure my models improve both on my local CV and on the public LB.

In some time series competitions, I set aside data for a period of time as a validation set.

I often choose my final submissions in a conservative way, I always choose a weighted average ensemble of my safe models and select a relatively risky one (in my opinion, more parameters equate to more risks). But, I never chose a submission I can’t  explain, even with high public LB scores.

In a few words, what wins competitions?

Good CV, learning from other competitions and reading related papers, discipline and mental toughness.

What is your favorite Kaggle competition and why?

Nature protection and medical related competitions are my favorite ones. I feel I should, and perhaps can, do something to make our lives and planet better.

What field in machine learning are you most excited about?

I am interested in all kinds of progress in deep learning. I want to use deep learning to solve problems besides computer vision or NLP, so I try to use them in competitions I enter and in my regular occupation.

How important is domain expertise for you when solving data science problems?

To be frank, I don’t think we can benefit from domain expertise too much, the reasons are as follows:

  1. Kaggle prepared the competition data carefully, and it’s fair to everyone;
  2. It’s very hard to win a competition just by using mature methods, especially in deep learning competitions, thus we need more creative solutions;
  3. The data itself is more important, although we may need to read some materials related.

But, there are some exceptions. For example, in the Planet Amazon competition, I did get ideas from my personal rainforest experiences, but those experiences might not technically be called domain expertise.

What do you consider your most creative trick/find/approach?

I think it is to prepare the solution document in the very beginning. I force myself to make a list that includes the challenges we faced, the solutions and papers I should read, possible risks, possible CV strategies, possible data augmentations, and the way to add model diversities. And, I keep updating the document. Fortunately, most of these documents turned out to be winning solutions I provided to the competition hosts.

How are you currently using data science at work and does competing on Kaggle help with this?

We try to use machine learning in all kinds of problems in banking: to predict visitors of  bank outlets, to predict cash we should prepare for ATMs, product recommendation, operation risk control, etc.

Competing on Kaggle also changed the way I work, when I want to find a solution to solve a problem, I will try to find similar Kaggle competitions as they are precious resources, and I also suggest to my colleagues to study similar, winning solutions so that we can glean ideas from them.

What is your opinion on the trade-off between high model complexity and training/test runtime?

Here are my opinions:

  1. Training/test runtime is important only when it's really a problem. When accuracy is most important, model complexity should not be too much of a concern. When the training data obtained resulted from months of hard work, we must make full use of them.
  2. It’s very hard to win a competition by only using ensemble of weak models now. If you want to be number 1, you often need very good single models. When I wanted to ensure first place in a competition solo, I often forced myself to design different models which could reach the top 10 on the LB, sometimes, even top 3. The organizers can select any one of them.
  3. In my own experiences, I may design models in a competition to explore the upper limitation of this problem, and it’s not too difficult to then choose a simple one to make it feasible in a real situation. I always try my best to provide a simple one to organizers and discuss with them in the winner’s call. I found some organizers even use our solutions and ideas to solve other problems they face.
  4. We can find that Kaggle has a lot of mechanisms to ensure the performance when the training/test runtime is important: kernel competitions, team size limitation, adding more data that aren’t calculated while scoring, etc. I am sure Kaggle will also improve the rules according to the goal of the challenge.

How did you get better at Kaggle competitions?

Interesting competitions and great competitors on Kaggle make me better.

With so many great competitors here, winning a competition is very difficult, they pushed me to my limit. I tried to finish my competitions solo as many times as possible last year, and I must guess what all other competitors would do. To do this, I had to read a lot of materials and build versatile models. I read all the solutions from other competitors after a competition.

Is there any recent or ongoing machine learning research that you are excited about?

I hope I can enter a deep reinforcement learning competition on Kaggle this year.

You moved up the leaderboard to take the number 1 spot very quickly (in just 15 months). How did you do it?

First of all, No.1 is a  measurement of how much I learned on Kaggle and how lucky I was.

In my first several competitions, I tried to turn the theories I learned in recent years into skills, and learned a lot from others.

After I gained some understanding of Kaggle competitions, I began to think about how to compete in a systematic way, as I have many years of experience in software engineering.

About half a year later, I received my first prize and some confidence. I thought I might become a grandmaster in a year. In Planet Amazon competition, I tried to get a golden medal, so it came to me as a surprise when I found out I was in first place.

Then I felt I should keep using the strategies and methods I mentioned before and got more successes. After I won the Cdiscount competition, I climbed to the top of Users Rank board.

I think I benefited from the Kaggle platform, I learned so much from others and the rank system of Kaggle also play an important role in my progress. I also felt so lucky as I I never expected I could get 6 prizes in a row, my goals of many competitions were top 10 or top 1%. I don’t think I could replicate the journey again.

However, I’m here not for a good rank. I always treat every competition as an opportunity to learn, so I try to select competitions from the field I am not so familiar with, which forced myself to read hundreds of papers last year.

You’ve mentioned before that you enjoy reading top-scoring competition solutions from past competitions. Are there any you would highlight as being particularly insightful?

I respect all the winners and wonderful solution contributors, I know how much effort they put into it. I always read the solutions with an admirable attitude.

A few of the most memorable insights came from Data Science Bowl 2017: the pytorch, 3D segmentation of medical images, the solutions from the Web Traffic Time Series Forecasting which use sequence model from NLP to solve time series problem, and the beautiful solutions from Tom (https://www.Kaggle.com/tvdwiele), and Heng (https://www.Kaggle.com/hengck23).

Mother's Day Interview: How Nicole Finnie Became a Competitive Kaggler on Maternity Leave

$
0
0

As Kaggle’s moderating data scientist for the Data Science Bowl, I’m fortunate to have met first-time competitor Nicole Finnie. Her team (Unet Nuke) impressively ranked within the top 2%, earning Nicole a silver medal. More impressively, I learned that Nicole had no ML/DS experience just a year ago, and picked up these new skills through online classes during her recent maternity leave.

As an expectant mother, I found Nicole’s story inspiring and am excited to share it with the broader Kaggle community this Mother’s Day.

Background

What’s your academic/professional background?

I hold a Bachelor degree in Computer Science and a Master degree in Software Engineering specialized in computer visualization. In the past 8 years, I’ve been a software developer in the database kernel area at a large R&D lab.

How’d you hear about Kaggle?

2 months ago, during a coffee break with our lead data scientist and a fellow Kaggler, @hafeneger, we were thinking of creating a new machine learning project in our lab, and he suggested “Why don’t we kaggle together?” And that was the first time I heard about Kaggle.

What's your secret for doing so well in your first Kaggle competition?

Getting information from the Kaggle forum was our first step to learn possible ideas, and then I researched those ideas further by reading the academic papers. Once I had a good feel for the theory, then it just took lots of time and work to implement. When you use a popular kernel, make sure to try to implement ideas and concepts from different research papers, that will be more likely to set you apart from other Kagglers. Most importantly, you need to choose competitions you’re passionate about.

Our Real Secret Weapon

What kind of methods did you try in the DSB competition?

Since it was an image segmentation competition, I tried different combinations of CNNs with different output channels and different post-processing methods to see which gave us the highest local metrics. And in the final week of stage 1, I wrote a fully automated pipeline to speed up training models with various data augmentations. In the final 3 days, a Kaggle grandmaster, also our remote colleague @CPMP joined our team. He advised us to ensemble our best 3 models using weighted majority voting and that made our solution more robust to unseen images.

Did your background in software engineering help you do well in the Kaggle competition?

Yes, it helped me to quickly convert ideas to code.

How was your experience teaming up in a Kaggle competition?

I teamed up with our data scientists @hafeneger and @alexec and my husband @jliamfinnie. All four of us come from different areas in our lab and we met up every week discussing new ideas, which was lots of fun. Modularizing our code without using Jupyter notebooks was the most efficient and realistic way to work as a team. In the final 3 days, we teamed up with our remote colleague, a Kaggle grandmaster @CPMP from another country, which was stressful but it pushed us to significantly improve our models in a short amount of time.

Will you join more competitions? What kinds of competitions most interest you?

For sure. I’m mostly interested in image competitions because you don’t need to ensemble 1000 models to win a competition. However, after the DSB, we’re broke due to costs of a cloud GPU VM, so it may take a while to save up for the next image competition. 🙂

Family/Parenting

What motivated you to pick up machine learning during your maternity leave?

Originally, I wanted to write an app for real-time object recognition for my newborn daughter, so I got interested in the deep learning field. During my learning, I “stole” (git clone) the tensorflow source code and built the said app using a pre-trained YOLO v2 model for my baby daughter. Now my one-year-old doesn’t want to give me my smartphone back. 🙂

How did you pick up machine learning/deep learning?

The student I supervised at work took the machine learning course at Coursera from Prof. Andrew Ng, so that became my natural starting place.

How did you manage your time to learn new technical skills, while being a first-time-mom at the same time?

Thanks to German labour law, I was able to enjoy a long paid maternity leave. I’m someone who just couldn’t stand being idle, so whenever my baby napped (which was only 20 minutes at a time), I used the time to learn machine learning online. I was very sleepy though.

How do you get time to compete in a Kaggle competition while having a full time job and a 1-yr old baby?

I tried to trick my baby to go to bed early so I could Kaggle after she fell asleep. Lots of coffee and tea helped. To be honest, I was physically exhausted, but the excitement of the competition kept me going.

Are there any additional resources you wish you had?

A babysitter for sure!!! We took care of our baby 24/7 by ourselves. I wish I had more time to kaggle.

Apple Juice Not Beer

Did your husband play a big role in this whole thing (your picking up new skills, joining Kaggle competitions, etc)?

Yes, my husband was on parental leave at the same time and we learned ML together. He played the biggest role. We teamed up in this competition. (I figured it was the only way not to violate the Kaggle rule: not sharing information privately outside the team. :p ) He was very supportive and we took turns: one person had to distract the baby when the other was Kaggling.

Did you ever have any anxiety that you’d have to choose between having children and having a career?

No, I like challenges. 🙂 Having children can be very inspiring. That gives you new ideas and makes you realize how little time you have and you want to squeeze value out of that precious little time. I hope to be a good role model for my daughter and let her know that you don’t need to choose between having a family and having a career.

On Mother’s Day, do you have anything to say to other mothers?

Happy Mother’s Day!! Oops, I meant to say “Embrace your passion, to have a happy kid, you need to be a happy and content mother.”


Profiling Top Kagglers: Martin Henze (AKA Heads or Tails), World's First Kernels Grandmaster

$
0
0

Let me begin by introducing myself: My name is Martin. I'm an astrophysics postdoc working on understanding exploding stars in nearby galaxies. From the very beginning of my studies, I was using data analysis to try to unveil the mysteries of the universe. From deep images taken with ground- and spaced-based telescopes, through time series measuring the heartbeats of extreme stars, to population correlations probing the fundamental physics behind incredibly powerful eruptions: learning the secrets of a complex cosmos requires all the tools you can get your hands on.

One year ago I started my first Kaggle Kernel. I had always been aware of the website and finally decided to take the plunge into a new and exciting adventure. My immediate goal was to systematically improve my very rudimentary knowledge of machine learning tools and methods. To learn new skills of a rapidly growing field and to use them in astronomy research. Become a better scientist. But soon I discovered that there was much more to the Kaggle community; and to the data sets everyone had at their disposal. My curiosity was kindled. Different challenges pushed me to expand my repertoire. I had tons of fun.

Before all that, though, the very first challenge was to find a catchy username; probably the most difficult step of all. Despite my affinity for statistics and randomness it took me embarrassingly long to come up with 'Heads or Tails'.

Martin Henze

I recently became the very first Kaggle Kernels Grandmaster thanks to the ongoing support of a great community. Like many of us, I started out with the famous Titanic competition which proved to be only the tip of the iceberg in terms of fascinating data sets. Encouraged by positive feedback from other Kagglers I joined new, live competitions. The slightly scary prospect of competing for real was made so much easier by an overwhelmingly friendly and supportive community. I made it my personal challenge to produce a fast and extensive EDA for each new challenge. Partly to give other competitors a head start, partly because I really enjoy exploring new data sets. Moreover, I discovered that I enjoy dissecting non-astronomical data sets just as much as my star-studded ones, and I'm becoming more and more interested in real-world data analysis.

In my view, Kaggle Kernels are a remarkable success story that allow truly reproducible data analysis and add a much more collaborative angle to any competition. Through Kernels, we are able to demonstrate a diverse set of problem solving methods, discuss technical intricacies, and most importantly learn from each other how to improve our skills in each competition and with each data set. I'm honoured and proud to be a part of this success story, and in the following I will happily respond to questions sent to me by the Kaggle team. If you would like to know more, or chat about data, just drop me a message or let me know in the comments. Have fun!

In general, what kinds of topics do great popular kernels cover?

I think that an insightful kernel can be written on any topic. The kernel format is so flexible that it allows us to adapt to a diverse set of challenges. For me it’s all about how to approach a problem; not so much about the nature of the particular problem. The large diversity of popular Kernels on Kaggle underlines this.

How long does it take you to write a kernel, on average? Do you do it all at once or do you break the work up into parts?

My Kernels focus primarily on detailed EDA - ideally with a baseline prediction model derived from it. The full kernel takes me about a week, maybe two, depending on the complexity of the data set. Since I love exploring, I normally aim to make quick progress in the early days of the competition to have a comprehensive view of the data.

I normally have the fundamental properties of the data set covered with a day or two, by which time I have a also defined a roadmap on how to conduct the more detailed analysis of individual features. As this analysis progresses, other insights are likely to be revealed that merit a dedicated follow-up treatment. Learning new analysis tricks and methods takes up at least a couple of hours per kernel. There is always something new to learn which is great.

I prefer to break my EDA into distinct but related parts such as the single- vs multi-parameter visualizations, correlation tests, or feature engineering. Those fundamental steps are similar from kernel to kernel, but their extent and importance can vary dramatically. This approach makes it easy to keep an overview of the big picture. Attempting to write an entire analysis kernel in one go can be a daunting task, especially for beginners, and I would advise against it.

This visualization is from the feature engineering section of Martin's DonorsChoose.org competition EDA titled "An Educated Guess".

Any tips to share in terms of kernel format best practices?

In my view, a good kernel should have a clear analysis flow that covers all the important aspects of the data. A step-by-step examination of the data characteristics. This greatly improves the understanding of the reader but also makes the life of the kernel author much easier. It is tempting to dive into specific details too quickly and lose yourself in the analysis. The aforementioned analysis steps help to prevent this and make sure to keep the big picture in mind.

If you find a significant insight during your detailed exploration then I recommend to tidy up the code and presentation immediately before moving on to the next step. This approach makes sure that specific aspects of your result don’t get lost during the course of the analysis. It also provides you with a clear and succinct picture of what you have found. Occasionally, upon closer examination you might also have to change your interpretation.

I highly recommend to document all of your ideas and approaches, including those that did not lead to useful results. Thereby, you won’t repeat an unsuccessful line of inquiry. In addition, other Kagglers can read up on your analysis and save time by avoiding those approaches; or possibly even get inspiration on how to tweak your ideas to make them more successful.

Do you promote your kernels on Kaggle somehow? If so, how do you do it?

Not in any significant way. I focus on competitions, so I sometimes post puzzling questions from my analysis to the corresponding discussion board to get feedback from a wider audience. Or I let the author of an external data set know that I included their contribution in my analysis. That’s about it.

How important is telling a good story to the kernels that you write?

A compelling narrative flow is an important feature of both an effective analysis and an engaging data presentation at the same time. Most Kaggle competitions have a specific aim; be it predicting taxi ride durations or forecasting website visits. Building a narrative around this goal helps to keep the big picture in mind and allows for a data-driven presentation. Having a story is good, as long as it organically arises from the data and underlines the main findings, rather than to overshadow them. Exceptions might exist for halloween-themed challenges 😉

What do I have to do in a kernel to impress you?

First off: I’m impressed by anyone who decides to write their first kernel on Kaggle and to share it with the community. This step can seem a bit scary, but it will provide you with valuable feedback to hone your skills as a data scientist. From there on, the most impressive skill is to be able to use this feedback to gradually improve your Kernels. Ideally, this would include learning not only from the comments on your own Kernels but also from related Kernels and the corresponding discussions.

Beyond that, I’m a big fan of data visualization and engaging narratives. The right plot says way more than the proverbial 1000 words. Stringing together a series of visuals to dive deep into the meaning behind the data is a feat that I will always be impressed with.

Example of elegant visualization contributing to a strong narrative. This is an alluvial plot from the Martin's NYC Taxi EDA. The vertical sizes of the blocks and the widths of the stripes (called "alluvia") are proportional to the frequency. This nicely shows how the fast vs slow taxi groups fan out into the different categories (during work time, time of day, JFK airport trip, etc.).

Are there any other kernel authors on Kaggle whose work you enjoy reading?

Allow me to shine a spotlight on three authors (in no particular order) whose work, I think, deserves more exposure. First, Jonathan Bouchet who constructs beautiful kernels with stunning visualizations to explore selected data sets. Second, Bukun who is getting better and better at the rapid exploration of competition data by providing EDA key points and prediction baselines. Third, Pranav Pandya and his polished highcharter visualizations with accompanying interpretation. These three Kagglers are definitely worth checking out. I’m certain you will continue to see more high-quality content from them in the near future.

I have learned a lot from SRK’s style of kernel design and Anisotropic’s comprehensive analyses. I admire the productivity and versatility of the1owl who can jump into any competition and provide robust benchmark code (and fun Kernel titles). I really like the Kernels of Philip Spachtholz and I hope he will find more time again to spend on Kaggle in the future. The various specialised Kernels of olivier, Andy Harless, Tilii, and Bojan Tunguz always provide great insights and benchmark code in competitions.

I could go on like this and still run out of space to list all the Kernel authors I enjoy reading. Every competition contains a mix of established favourites and new talented members of the community.

What is your personal favorite kernel that you’ve written?

My favourite one is probably The fast and the curious EDA for the Taxi Playground competition. I knew very little about geospatial visualization when it started and pushed myself to learn quickly about leaflet, maps, and how to dissect traffic patterns. This led to a challenging and fun contest for the first Kernels prize with Beluga, who’s excellent modelling Kernel had him leading the prediction score board from an early point on. In many ways, the competition was a lot of fun and showcased the immense potential of the Kernel format. It’s no coincidence that we had already two other playground competitions since then.

How about favorite kernels by other kernel authors?

There are so many great kernels out there that it’s hard to pick specific ones. Here are five (again in no particular order) that I enjoyed reading: (if you’re interested in more check out my list of upvoted Kernels)

Jonathan Bouchet’s Flight Maps are showcasing R’s power for geospatial plots and containing one of my all-time favourite plots on Kaggle (you know which one when you see it).

Anisotropic’s benchmark stacking Kernel for Titanic has taught many of us, including me, important fundamentals on how to improve the performance of individual classifiers by combining their predictions.

Selfish Gene’s narrative Kernel for the Taxi Playground Competition was weaving great visuals into a compelling exploration of the spatio-temporal features of traffic flows.

DrGuillermo’s NYC Dynamics animation Kernel for the same competition was a prime example on how to construct a focussed analysis around a specific, well-defined aspect of a data set.

Pranav Pandya’s Kernel on the Work Injuries data set introduced me for the first time to the power of highcharter plots and is a great and succinct introduction to high-quality visualisations. He even makes pie charts look aesthetically pleasing - and I can’t stand pie charts 😉

Is working on competitions and writing kernels complimentary, or are they two different things?

In my view, a successful understanding of the data - and therefore a succcessful prediction - is based on a thourough EDA. My kernels focus primarily on this EDA with the goal to unveil the impactful features in the data and their relation. It is of course possible to train a successful predictor without plotting anything at all. However, in my view even in this case the interpretation of the findings can be greatly enhanced by studying visual representations of the interconnections within the data set.

In addition, I’m a very visual person. Plotting a data set from many different angles, and with many different styles and tools, helps me immensely in discovering patterns and correlations. Not everyone will appreciate data visualisations as much as I do; and that’s perfectly fine. The Kernel format gives us the flexibility to implement many different styles of data analysis. More importantly: A Kernel is a perfect lab book in which to document your approach and results - and therefore a great foundation for a successful competition contribution. In my view, learning how to plan, execute, and document your work is one of the most fundamental building blocks for the success of any data-related project.

What would you say you have you learned from writing kernels? From viewing other people’s kernels?

Where to start? My data science journey, beyond my narrow academic field, pretty much began on Kaggle Kernels and is still in its early days. I’m learning a lot with every Kernel and every competition - and I enjoy diving into the intricacies of ML models and EDA styles.

From writing Kernels I learned how to apply my academic methods to a large diversity of data sets. I took joining Kaggle as an opportunity to learn more about the Python packages pandas and sklearn, and to extend my experience with the notebook format. In R, I had only ever used the base graphics and I decided to learn about the tidyverse and ggplot2; which turned out to be a rather fortuitous decision. I documented my learning process in my (early) Kernels; picking up Rmarkdown tricks on the way. Most tools and specific visualisation methods that you see in my Kernels I learned during the last year.

Reading other people’s Kernels was hugely important for my rapid progress on Kaggle in the first months; and continues to be a major driver for innovations and improvements in my analysis style. Kagglers like SRK, Anisotropic, or Philip Spachtholz played a large role in shaping my EDA approach. The Titanic competition was, and remains, a treasure trove for tutorials, code snippets, and visualisation tricks. Whenever I learned something new from an well-written Kernel I tried to find an application for it in my analysis. An example are the compelling alluvial plots I first encountered in retrospectprospect’s work and then employed in my Taxi challenge kernel.

How important is being one of the top three kernels on a dataset for visibility?

It is important, but I believe that useful and successful Kernels will often gain popularity quickly and rise to the top. There certainly is a correlation between quality and popularity. However, I also see considerable variance around this general trend. One factor to take into account is that some Kernels will be excellent but only cater to a specific audience / aspect of the analysis. Those might not get the popularity they deserve. In turn, most EDAs address a wide audience, ideally including beginners, and will as such receive more exposure. My Kernels have certainly benefitted from this and it is important to stress that despite their popularity they will not necessarily the best Kernels in a certain competition, nor the most applicable to any situation or question you are facing. The large diversity of Kernel styles is a major strength of Kaggle and I encourage everyone to read more than just the top popular Kernels for each competition or dataset.

In general, instead of publishing many short Kernels, I recommend to authors to build one or two more comprehensive Kernels that grow and evolve as the competition progresses (or the time after the data set publication elapses). This includes adding interpretation, documentation, and context to your code. Those Kernels will naturally gather more visibility with every substantial update. I would like to take the opportunity to emphasise the word “substantial” here, and to discourage Kagglers from running an unchanged Kernel over and over (and over) for maximum visibility. Lately, there have been extreme cases of this behaviour and they create a lot of noise in the otherwise successfull popularity ranking.

Users occasionally share meta-analyses - kernels analyzing other users, or other kernels, or Kaggle itself. Do you read these, and if so, are there any in particular you enjoy?

I like these meta-kernels, especially the ones that focussed on the 2017 Kaggle survey. The Kaggle community itself is a rich source of data from which to derive insights into our demographics and software preferences. Two examples I enjoyed reading were comprehensive EDAs by I,Coder and Mhamed Jabri on the path from novice to grandmaster and Kaggler’s insights into data science. Those works focussed on a specific narrative to explored the available data.

At the same time, meta-kernels are often facing the danger of merely touching the surface level of descriptive charts without offering a novel angle or in-depth interpretation. While it is always nice to find familiar names and works to be featured in overview plots, there is so much more that such meta-kernels can accomplish. I think there is substantial potential for a detailed analysis of many different aspects of our community. I encourage you to explore your meta-kernel ideas and let me know about them.

Highly polished kernels tend to feature great data visualization. Do you have any data visualization libraries or tools that you are especially partial to?

Without a doubt: Hadley Wickham’s ggplot2 package. For me, its style and versatility are head and shoulders above the competition, and it aligns so well with my natural analysis style that it’s almost a bit spooky. The ggplot2 notation and approach also interface well with the programming philosophies that underlie Hadley’s tidyverse collection of general data analysis packages. I can highly recommend to check out these tools if the analysis in my Kernels flows smoothly for you. Everyone has their own style of data treasure hunting and I think it is important to find tools that are a natural extension of this style.


In terms of more specialised R tools there is the leaflet package, building on the eponymous javascript libraries, which was a revelation for me when dealing with geospatial maps for the first time. I also recommend the ggExtra package, an independent extension to ggplot2, for its multiple useful features. In terms of Python plotting libraries I prefer seaborn. In general, I have a strong penchant for scripted tools instead of interactive ones because of their ease of reproducibility and documentation.

In many of your kernels you partake in extended discussions with other authors. Any particularly interesting or insightful comments you would highlight?

The discussions within the comments are very useful and educational for me; be it for my Kernels or those of others. I truly appreciate everyone who takes the time to offer their thoughts or feedback on my work. Especially any suggestions for improval of my coding or visualisations. And of course the puns. I love the puns. Keep them coming. Occasionally I would pose questions in my Kernels and I’m always delighted when people contribute their answers. In the same way I’m happy to answer specific queries that other people might have for my Kernels. Often it simply makes my day when I receive a positive comment.

Some specific examples (many thanks to all!): I remember getting help with coding problems in my first Titanic Kernel. In several of my Kernels Oscar Takeshita has given me valuable feedback. Sometimes important additional information is first contributed in a comment. In the Mercedes Competition last year my Kernels got a lot of great feedback and contributions from Marcel Spitzer based on his own excellent Kernel.

Example of how feedback from Marcel Spitzer resulted in a better Kernel.

Now that you’re a kernels grandmaster, what is your next goal on Kaggle?

Honestly, I see myself still at the beginning of my Kaggle journey and I know that I have so much to learn. I’m planning to focus more on competition predictions and model building, which I had somewhat neglected by tackling many EDAs in a short time. As many of us, I would like to gain more experience with deep learning and the corresponding, rapidly evolving analysis tools and libraries. Placing higher than bronze in a competition is my first short-term goal; reaching the Competitions Master status is the next one.

I will focus on a few solo competitions to get my modelling skills up to speed, but I would also enjoy being part of a team. I foresee that collaborative work will become an even stronger focus on Kaggle due to the Kernel sharing features. Plus, working as a team is fun.

Of course, my love for exploring will also have me contributing more EDAs in the future. There are a number of visualisation tricks and tools that I would like to try out in future Kernels. And hopefully my work will continue to be useful to the community. There’s always more to explore.

Do you think there will be another Kernels Grandmaster anytime soon? If so, any ideas on who it might be?

It is a testament to the dynamic nature and fast progress of the Kaggle community that while I was pondering these questions, SRK became the next Kernels Grandmaster. Congratulations! His achievement is amazing: reaching the highest level in the Competitions and Kernels categories simultaneously. I hope to read a similar interview with him in the near future.

Even beyond SRK: based on the data I’ve seen, I predict that the next Kernels Grandmasters will claim their title relatively soon. I don’t want to mention specific names (since everyone sets their own targets) but there are several strong contenders. You know who you are 😉

In general, the popularity of the kernels continues to rise and we’re seeing more and more high-quality contributions to receive a large number of well-deserved upvotes. The key to reaching to the Grandmaster level is continuity. There are several Kagglers who have displayed this continuity since way before I joined the community (and way before kernels were available). In addition, there are several other Kagglers who have yet to reach their full potential. Many more new contributors will join them over the coming months. It will be an exciting time for the Kaggle community and I’m looking very much forward to it.

Winner Interview | Particle Tracking Challenge first runner-up, Pei-Lien Chou

$
0
0

What does it take to get almost to the top? Meet Pei-Lien Chou, the worthy runner-up in our recent MLTrack Particle Tracking Challenge. We invited him to tell us about how he placed so well in this challenge.

In this contest, Kagglers were challenged to build an algorithm that would quickly reconstruct particle tracks from 3D points left in the silicon detectors. This was part one of a two-phase challenge. In the accuracy phase, which ran from May to August 13th 2018, we focused on the highest score, irrespective of the evaluation time. The second phase is an official NIPS competition (Montreal, December 2018) focused on the balance between accuracy and algorithm speed.

For more on the second phase, see the contest post here. For tips from second-place winner Pei-Lien Chow, read on!

The basics

What was your background before entering this challenge?

I hold a Bachelor’s degree in Mathematics and a Master’s degree in Electronic Engineering. I’ve been an engineer in image-based deep learning since last year.

How did you get started competing on Kaggle?

I joined Kaggle about 1.5 years ago to practice deep learning, and it helped a lot in my day job. I got a top 1% in my first competition, and won in the next. It is really exciting to be in Kaggle competitions.

What made you decide to enter this competition?

I did not pay attention at first, because the competition was not image-based, although I did experiment with some point cloud methods during this competition. But when I realized that the organizer was CERN,  the people who are making black holes, I joined for sure. 🙂

Let's get technical

What was your approach?

My approach started from a naive idea. I wanted to build a model which could map all of the tracks (the model output) to the detector hits (the model input) for each event, just like we use DL for other problems. The output can be easily represented by NxN matrix if an event has N hits (usually N is around 100k), and Mij = 1 if hit-i and hit-j are in the same track, otherwise 0. But the model size was too large, so I split it into minimum units: input a pair of two hits and output their relationship (Fig.1). Unlike the real “connect the dots” game which only connects adjoining dots, I connect all the dots if they belong to the same track for robustness. Now, I'm ready to start working in this competition.


What happened?

First, I used hit location (x, y, z) as my input, and easily got an accuracy of 0.99 by training on 10 events. But I quickly discovered that this was not good enough to reconstruct tracks. The problem is that even if the false positive rate = 0.01, for a given hit, the false positive pair count = 0.01*100k = 1000, and the true positive pairs are around 10 (the true average length of tracks). But we need the overlap to be larger than 50% both on truth and the reconstructed one to start getting a score.

What happened next?

I got a 0.2 local score on my first try, which was the same as public kernels at that time. I was guessing that maybe 0.6 would win, and hoping that was possible by my approach. God knows!

How did you get to better predictions?

I tried so many methods, and I did improve much more than I expected.

  • Larger model size and more training data
    5 hidden layers MLP with 4k-2k-2k-2k-1k neurons, training on 3 sets of totally 5310 events, about 2.4 billion positive pairs and many more negative pairs.
  • Better features
    27 features in one pair: x, y, z, count(cells), sum(cells.value), two unit vector come from cells to estimate the hit's direction and random invert when training (Fig.2), and assumed that the two hits are linear or helix with (0, 0, z0), calculate the abs(cos()) with previous two estimated vectors and the tangent of the curve, and the last one is z0.

  • Better negative sampling
    Sampling more negative pairs which are close to positive pairs, and applying hard negative mining.

Finally, I got an average of 80 false positive pairs for a given hit at 0.97 TPR, and only 6 false positive pairs’ probability are larger than the mean of true positive pairs.

How did you reconstruct tracks?

So far I have a not-so-precise NxN relationship matrix, but it is enough to get good tracks if I use all of them.

Reconstruct: Find N tracks

  1. Take one hit as seed (such as hit-i), find the highest probability (and larger than a threshold) pair P(i, j), then add hit-j to the track.
  2. Find maxima P(i, k) + P(j, k) and if the two pairs’ probability are larger than a threshold, then add hit-k to the track.
  3. Test the new hit to see whether it fits the circle in x-y plane by existing hits after the track has two or three hits. (Without this step I can only get to an 0.8 score.)
  4. Find the next hit until no further hits are qualified.
  5. Loop step 1 for all N hits. (Fig.3)

Merge and extend

  1. Calculate the similarity of all tracks as is track’s quality, which means in a track if all hits’(as seed) corresponding tracks are the same, then the merging priority of the track are higher. (Fig.6)
  2. Choose high priority tracks first, then extend them by loosening the constraints in the reconstruction step.
  3. Loop.

Other work
I added an z-axis constraint and ensemble of two models in the end, and got a 0.003 improvement.
I also tried to apply PointNet to find the track on the predicted candidates and track refining. Both performed well but not better.


Fig.3 An example of reconstruction of an event with 6 hits.


Fig.6 An example of the determination of merging priority

Fig.4 The seeds (large circles) and their corresponding candidates (of matching colors) in x-y plane. It's clear that the seeds are in a track.


Fig.5 The diameter of each hit is in direct proportion to the sum of predicted probability seeding by the nine truth hits (in red).

Here is a kernel for reference

I call this process as endless loop, and it is far from my own original idea. Nevertheless, I was very happy when I passed 0.9 in the end. 🙂

What was the run time for both the training and prediction of your winning solution?

You know, I have to train on 5k events and apply hard negative mining. And for every test event, I have to predict 100k*100k pairs, reconstruct 100k tracks (actually 800k+ in the winning solution), merge and extend them to 10k tracks. So the run time is an astronomical number. To reproduce all this work might take several months on one computer. 🙁

Words of wisdom

Is DL suitable for this topic?

In my opinion, it depends on whether the target can be well described. If so, then the rule-based method should be better. In other words, a clustering approach can get 0.8 in this competition, so applying DL is asking for trouble. But also having fun. 🙂

Do you have any advice for those just getting started in data science?

Join Kaggle now (if you haven't already) and just get started.

Bio

Pei-Lien Chou is an engineering team lead in image-based deep learning. He has 12 years of experience in the video surveillance industry. He holds a Bachelor’s in Mathematics at National Taiwan University and a Master’s in Electronic Engineering specialized in speech signal processing at National Tsing Hua University.

From a Night of Insomnia to Competition Winner | An Interview with Martin Barron

$
0
0

Last year we took our annual data science survey to the next level by turning over the results to YOU through an open-ended Kernel competition.

We were overwhelmed by the response and quality of kernels submitted. Not only are Kagglers amazing data scientists, but they’re incredible storytellers as well!

Martin Barron was one of those skillful enough to take our data and shape it into something meaningful— not just for Kaggle, but for the data science community at large. We hope you enjoy getting to know him as much as we did.

Congrats, Martin on your win!


To take a look at Martin’s winning Kernel, visit: The Gender Divide in Data Science


Martin, what can you share about your background?

I am an associate director at the University of Chicago’s Urban Labs, where we work with civic and community leaders to identify promising social programs and public policies.  In my current position, I manage a team of 15 talented analysts and data scientists, who do the important work of rigorously evaluating those programs to ensure they are effective and efficient.  

Prior to my current position, I worked for a large survey organization doing work quite similar to this challenge. My previous job often involved examining raw output from surveys, extracting key insights from the data, and constructing a coherent narrative from those insights.


What made you decide to enter this admittedly unconventional challenge?

In all honesty, insomnia.

I woke up early one night and stumbled upon the competition while looking for something to keep me occupied. After reading the description, I was immediately attracted to the idea of using the dataset to investigate gender differences in the data science field. It’s a topic I care a lot about, and the Kaggle dataset seemed to present a fairly unique opportunity to investigate the topic.

I also, frankly, really was attracted to the opportunity to once again “get my hands dirty” with some survey data analysis.  My current position is largely managerial, and when I do get the opportunity to perform some analysis, it tends to be on much more limited administrative datasets.


Were any methods particularly helpful in doing your analysis?

This competition was, obviously, quite different from other Kaggle challenges because it did not require any machine learning. (Indeed, the fact that that competition didn’t require machine learning is another reason I decided to enter, as it meant I had a chance of placing!)

Although the survey collector removed some spam responses, I noticed that there were other entries I felt warranted deletion.  I ultimately removed additional entries where more than 80 percent of questions were unanswered or where respondents spent fewer than 5 minutes answering the questions.  Although this resulted in dropping almost 7,000 respondents, I felt the results would be stronger if these (likely) junk responses were removed.


What was your most important insight into the data?

My early drafts were much longer and used many more of the survey questions than my ultimate submission. They were also a lot more boring. So probably the most important insight I had was that there was a coherent story to be told just highlighting a few key points.


Were you surprised by any of your insights?

I know I shouldn’t have been surprised, but I nevertheless was surprised to see the gender differences in reported salaries.  It’s one thing to hear that that the median salary for women is less than that of men; it’s another thing to actually calculate it on data in your hands and see women earning 86 percent of what men earn.


Which tools did you use?

All of my analysis for this project was conducted in R.  After some initial exploratory analysis, I worked exclusively in R Markdown using R-Studio.


What have you taken away from this competition?

My biggest takeaway is that we, as a discipline, need to do more. As I say in my entry, “Ours is a young discipline. Let us fight now to make it a just and equitable profession not only for its current practitioners, but all of those who are to follow.” One small thing that I’ll be doing is making a donation to two organizations,  CoderSpace and App Camp for Girls, working to make computer science (and thus, by extension, data science) more inclusive.  They are really great groups that I’d encourage others to support.


Martin Barron is the Associate Director of Data and Analysis in Crime and Education Labs at the University of Chicago Urban Labs. Urban Labs works closely with civic and community leaders to identify, test, and help scale the programs and policies with the greatest potential to improve human lives. Martin received his Ph.D. in Sociology from SUNY Stony Brook. His current research focus is on quality assurance in analysis and data sciences.


A snippet from Martin's winning kernel

Hackathon Winner Interview: RUDN University | Kaggle University Club

$
0
0
People's Friendship University of Russia Campus

Welcome to the second installment of our University Club winner interviews!

Today’s university students are tomorrow’s leading data scientists. That's the catalyst for Kaggle University Club — a virtual community and Slack channel for existing data science clubs who want to compete in Kaggle competitions together. As our end-of-year event for 2018, we hosted our first-ever University Hackathon.

18 total kernels were submitted and the three top-scoring teams won exclusive Kaggle swag and an opportunity to be featured here, on No Free Hunch. Please enjoy this profile from one of the top-scoring university teams, ‘Team 5 top 100’ fromPeople Frienship University of Russia (RUDN)!

To read more about the Hackathon and its grading criteria, see Winter ‘18 Hackathon. To read this team’s winning kernel, visit: Team 5 top 100: Predicting Review Scores Using Neural Networks


MEET THE STUDENTS


Prikhodko Stanislav

Major: Computer Science
Hometown: Donetsk, Ukraine
Anticipated graduation: Summer 2020


What brought you to data science?

At school I fell in love with Python, so in university I decided to try to develop a site on Django. It was kinda boring, so I started to learn data science instead. I wrote a class project on bank scoring and five additional projects just for fun. After that I joined ODS and earned a top 25 place in one text classification competition. Later, I began  Deep Learning on CS231n and CS224n, won some money in a hackathon, and a bronze medal in the Kaggle Toxic Classification Challenge. In the summer I started working as a ML researcher at the start-up where I currently work.

What are your career aspirations after graduation?

I want to work at least one year in California, Japan and Europe as a ML researcher or engineer.


Daniil Larionov

Major: Fundamental Computer Science and IT
Hometown: Volzhskiy, Russia

What brought you to data science?

Originally, I dreamed about designing systems which help people in need. My first project was about analyzing tweets. I read a lot about NLP, classification problems and some general ML stuff. Since then, I've done a course project on ML and got an offer for a part-time job in NLP lab in a research institute. There, we are working on different projects, from analyzing ecological situation by tweets to working with people's essays.

What are your career aspirations?

I'm really enjoying research and I'd like to be research engineer.


Kuzmin Sergey

Major: Fundamental Computer Science and IT
Hometown: Kaluga, Russia

What brought you to data science?

I simply want a well-paying job, so that led me here. 🙂

What are your career aspirations?

I would like to work as machine learning engineer at a startup.


Katherine Lozhenko
Major: Fundamental Math and IT
Hometown: Moscow, Russia

What brought you to data science?

My dream of world dominance.


What are your career aspirations?

To be a research engineer would be the most interesting job I can think of.


Rustem Zalyalov
Major: Computer Science
Hometown:
Niznekamsk, Russia

What brought you to data science?

Whole my life I was interested in computer graphics and computer vision, so I took cs231n and started to participate in different hackathons like this with my friends from Confederation (our club name). Also I am working at Russian Academy of Science as researcher.

What are your career aspirations?

I don’t know what I want exactly, but I want to get interesting and well-paying projects.


TEAM QUESTIONS


How familiar was your team with Kaggle competitions prior to the Hackathon?

Pretty familiar. A year ago three of us, Stas, Daniil and Rustem, earned bronze medal in the Toxic Classification Challenge. We also participated in a huge number of other playground competitions, mainly for T-shirts and swag.


How did your team work together on your Kernel?

We worked independently on different parts. Someone researched science field (found different papers on arXiv.org), another one of us wrote the explanation, someone else visualized and analyzed the non-text data, someone prepossessed texts and fir models, and another one served as project manager for everything.


What was the most challenging part of the hackathon for you?

We had experience in this field, so the hardest part was managing and collecting everything into one kernel.


What surprised you most about the competition?

We didn’t face any surprises. Being well-organized helped a lot.


What advice would you give another student who wanted to compete in a Kaggle competition or even a hackathon?

If you want to win on Kaggle, just start to participate! Explore kernels and read discussions. Google anything you don’t understand, find friends to compete with and  join any data science community, like this University Club or ods.ai.


Anything else?

Thanks for this cool hackathon! It will help us to improve data science and computer science in our university. We feel like we can motivate students for more intensive learning and influence the administration to continue supporting us.


Awesome job, team!

Hackathon Winner Interview: Hanyang University | Kaggle University Club

$
0
0

Welcome to the third and final installment of our University Club winner interviews! This week the spotlight is on a top-scoring university team, TEAM-EDA from Hanyang University in Korea!

Today’s university students are tomorrow’s leading data scientists. That's the catalyst for Kaggle University Club — a virtual community and Slack channel for existing data science clubs who want to compete in Kaggle competitions together. As our end-of-year event for 2018, we hosted our first-ever University Hackathon.

18 total kernels were submitted and the three top-scoring teams won exclusive Kaggle swag and an opportunity to be featured here, on No Free Hunch. TEAM-EDA was one of those top teams.

To read more about the Hackathon and its grading criteria, see Winter ‘18 Hackathon. To read TEAM-EDA's winning kernel, visit Recommending Medicine by Review.


MEET THE STUDENTS


Hyunwoo Kim
Major: Industrial Engineering
Hometown: Bucheon, Korea
Anticipated graduation: 2020

What brought you to data science?

I took a data mining course and the professor hosted a classification challenge across 10 teams. Our team applied various models like SVM, NN, RF and K-NN. The professor of the course released the score at the last presentation, and we got the best score. I’ve never forgotten this moment, and this brought me to data science.

What are your career aspirations?

I’m interested in general analysis, not necessarily in a specific field. I would also like to work with tabular data. I also aspire to be a competition grandmaster in Kaggle.


Jiye Lee
Major: Financial management
Hometown: Seoul, Korea
Anticipated graduation: 2019

What brought you to data science?

I'm interested in the process of identifying and interpreting the meaning of the data. So, I worked on various data science projects as much as possible.

What are your career aspirations?

Because my major is finance, I would like to analyze data related to finance.


Sumin Song
Major: Financial management
Hometown: Masan, Korea
Anticipated graduation: 2020

What brought you to data science?

I became interested in data analysis as I learned statistics through R programming in college. I think it’s attractive to be able to verify my ideas or hypotheses empirically through data.

Career aspirations:

Although I haven’t decided yet, I want to be a data scientist in financial fields such as risk management and so on.


Juyeon Park
Major: Business administration
Hometown: Seoul, Korea
Anticipated graduation: 2019

What brought you to data science?

At first, I just liked coding because I could realize my thoughts through it. In particular, the process of refining data and obtaining insights gives me pleasure. I also found it helpful to be able to apply statistics in business administration.

Career aspirations?

It was my dream to become a data scientist in the insurance business. This month, I realized that dream! So my future goal is to improve understanding of insurance through work and become a NLP specialist.


Eunjoo Min
Major: Financial Management
Hometown: Seoul, Korea
Anticipated graduation date: 2019

What brought you to data science?

I’ve been interested in statistics since I was a high school student and took lectures about statistics and computer science as I started studying in my uni. I started becoming interested in data analysis thanks to these lectures and since then I’ve been participating in various projects

Career aspirations:

Data scientist, specialized in natural language processing or structured data.


TEAM QUESTIONS


How familiar was your team with Kaggle competitions prior to the Hackathon?

Except for one member, this was our second competition. We competed in the House Prices: Advanced Regression challenge. Other than that, we only studied kernels and discussed finished competitions.

How did your team work together on your kernel?

We began most of the project within the kernel and wrote some of the codes in the local environment. Every member came up with ideas about how to use the data and find the most useful results. Several members were familiar with NLP before, so they focused their efforts there. Other members were experienced in deep learning and handled other areas. Based on what each expert brought back, we wrote the kernel along with data visualization. We concluded by organizing the report together.

What was the most challenging part of the hackathon for you?

Two main challenges:

1. NLP in English was quite challenging. I thought it would be easier in English (I heard Korean is harder because of its structure) but it was quite different from Korean and we had to adjust.

2. It was difficult to select the final report topic because it was so open-ended. Also, emotional analysis was difficult because we had never tried emotional analysis before.

What surprised you most about the competition?

1. We’ve previously participated in a project dealing with online reviews in E-commerce markets and never thought of the counts improving the end result. In our kernel, we showed useful counts can be helpful in checking if a review is important or agreed on by many users, which can lead us to better recommendation.

2. We were surprised to see that the prediction performance got worse than before preprocessing. (It was like a mystery to us!)

What advice would you give another student who wanted to compete in a Kaggle competition or hackathon?

I would highly recommend trying Kaggle competitions if you’re hesitant to try it. We started trying without knowing anything, and now we’ve been at it for almost a year! (Yet I have no competition medal, haha.)

You can also learn a lot by reading kernels of other participants. If you are not experienced in data science yet, kernels are such a good opportunity to learn.

Finally, Kaggle can give you the best experience in every type of data analysis. It doesn’t matter if you win or not, it’s just worth trying for the experience alone. Try as much as possible, and the prize will come to you soon!

Anything else?

We are so glad to win this hackathon, and our team will keep taking on new challenges. Thank you for giving us this amazing opportunity.

Fantastic job, team!

TEAM EDA FROM HANYANG UNIVERSITY (FROM LEFT TO RIGHT: EUNJOO MIN, SUMIN SONG, JIYE LEE, HYUNWOO KIM, JUYEONG LEE, SANGHYONG JUNG).

Viewing all 62 articles
Browse latest View live